DIRECTOR'S COMMENTS

-Andrew McGowan, Director

[The 2026 State of the Bay report] presents the status of the Barnegat Bay Partnership’s eight ecosystem-based targets which represent holistic metrics of the Bay’s health. These targets were established by the Partnership during the creation of the 2021 Comprehensive Conservation and Management Plan, and provided the foundation for the 2021 State of the Bay Report. The eight integrated targets were established not only to guard against future loss/degradation but also to work towards restoration and measurable improvements. Broadly, the targets address the water quality of the bay (public swimming beaches, shellfish harvest areas), habitats of the bay (submerged aquatic vegetation extent, wetland acreage, riparian buffers, and hard clam populations), and water supplies to the bay (water conservation, ecological flows). Thus, achieving these targets would result in a healthy and resilient Bay and watershed.
At this time, the status of many targets is unknown. Most require bay-wide mapping or assessments which are both time consuming and costly. Thus, the statuses of targets are updated infrequently. Since the initial creation of targets five years ago, the Partnership committed to and successfully obtained almost $900,000 to update submerged aquatic vegetation extent, riparian buffer and wetland mapping, and establish ecological flow thresholds. This work is expected to be completed within the next several years. While many “Unknown” statuses are given in this report, tremendous progress has been made since the targets were established in 2021. For each target in the report, we have provided an update on the progress to date and also identified needed investments.
2 Indicators
Not Achieving
0 Indicators
Targets Achieved
2 Indicators
In Progress
4 Indicators
Unknown
LOOKING AHEAD
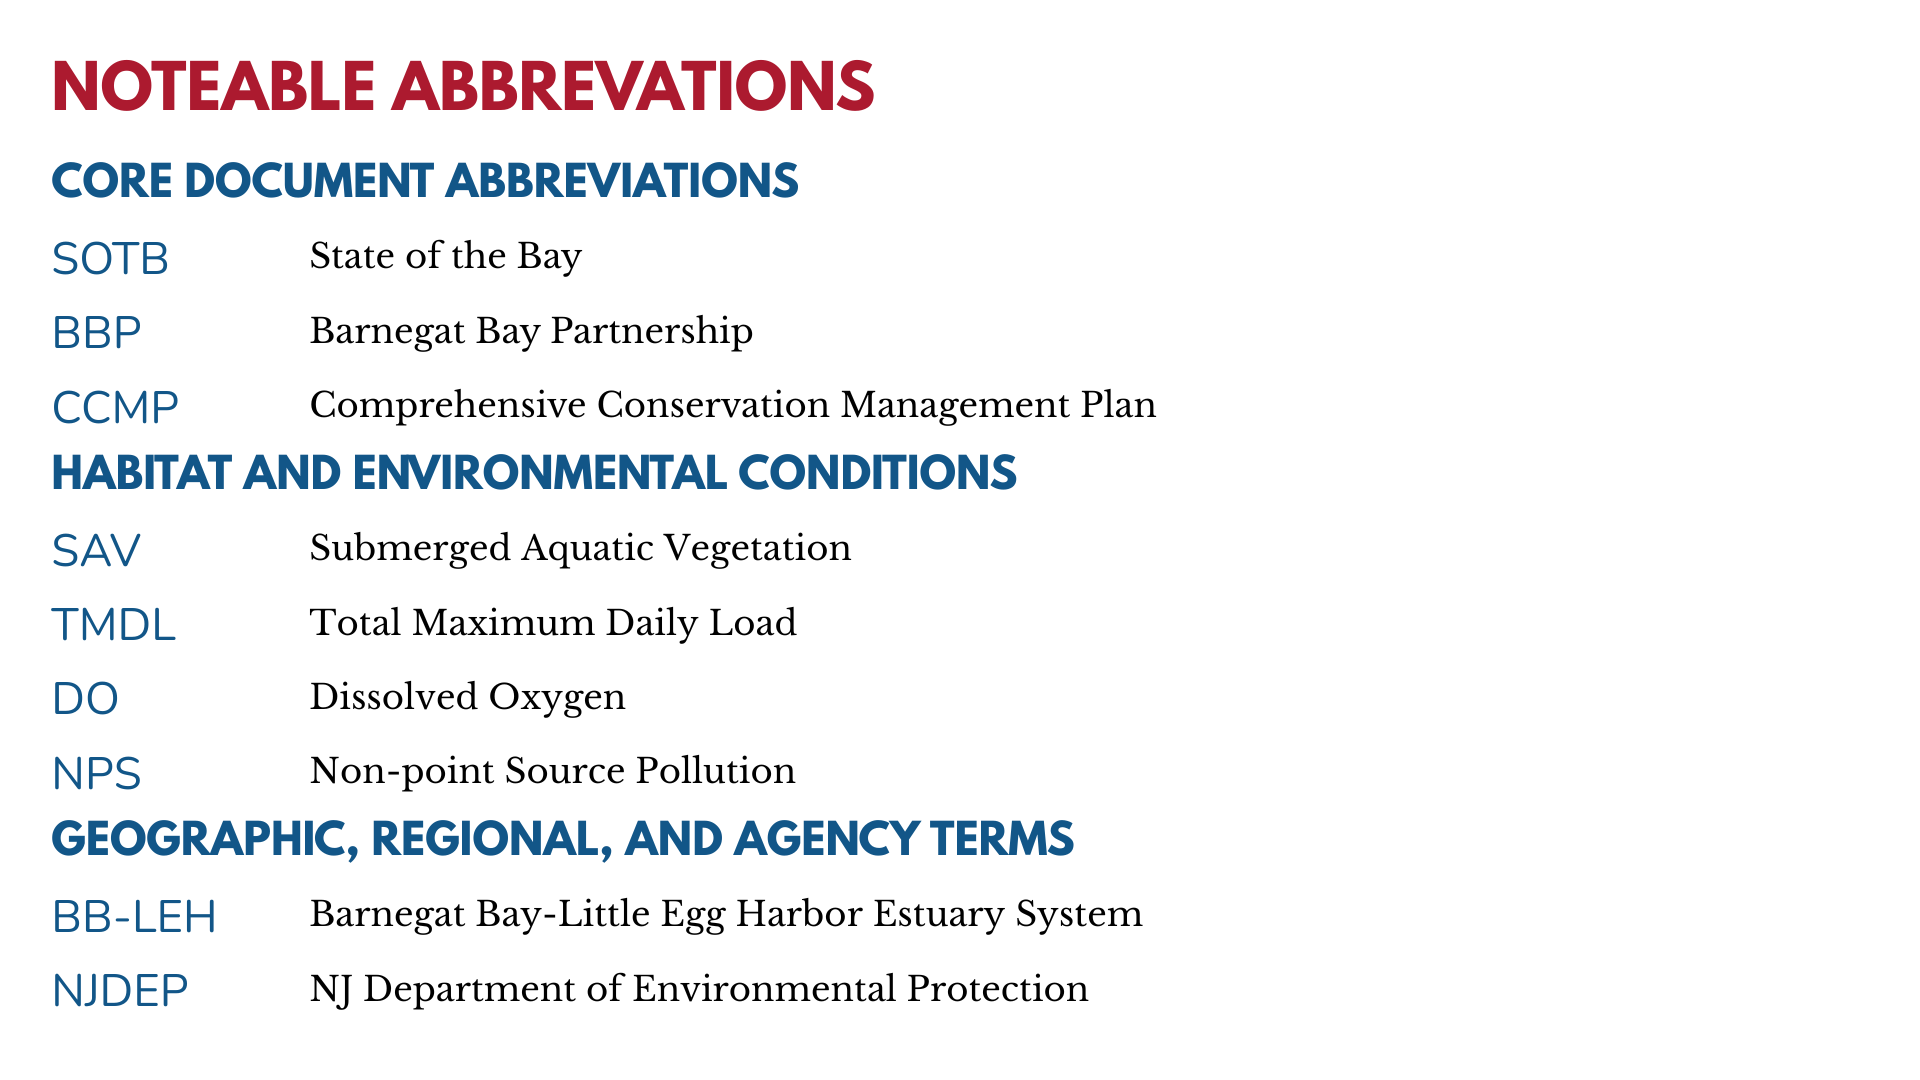
At its core, the Partnership is a water quality organization. Healthy nutrient concentrations are fundamental to the mission of the Partnership. While there is no specific adopted nutrient reduction target just yet the soon to be proposed Total Maximum Daily Load (TMDL) of Nitrogen represents a culmination of over 15 years of work by the NJDEP, USGS, and other partners to establish a nutrient load and water quality criterion. Unfortunately, many water quality stations do not meet the new standard, especially those in the northern Bay, where more work needs to be done. However, strengthened stormwater regulations and fertilizer laws may already be starting to have an effect: Total Nitrogen concentrations have not increased at any station in the Bay over the last ten or more years. Studies in other systems suggest changes in land practices may take a decade or more to manifest in the Bay’s waters; thus, no stations getting worse over the past ten years is an optimistic sign of progress. With the implementation of the TMDL, we’ll hopefully see more progress in the future. Just remember, the bay is everyone’s responsibility!
HOW TO USE THIS REPORT
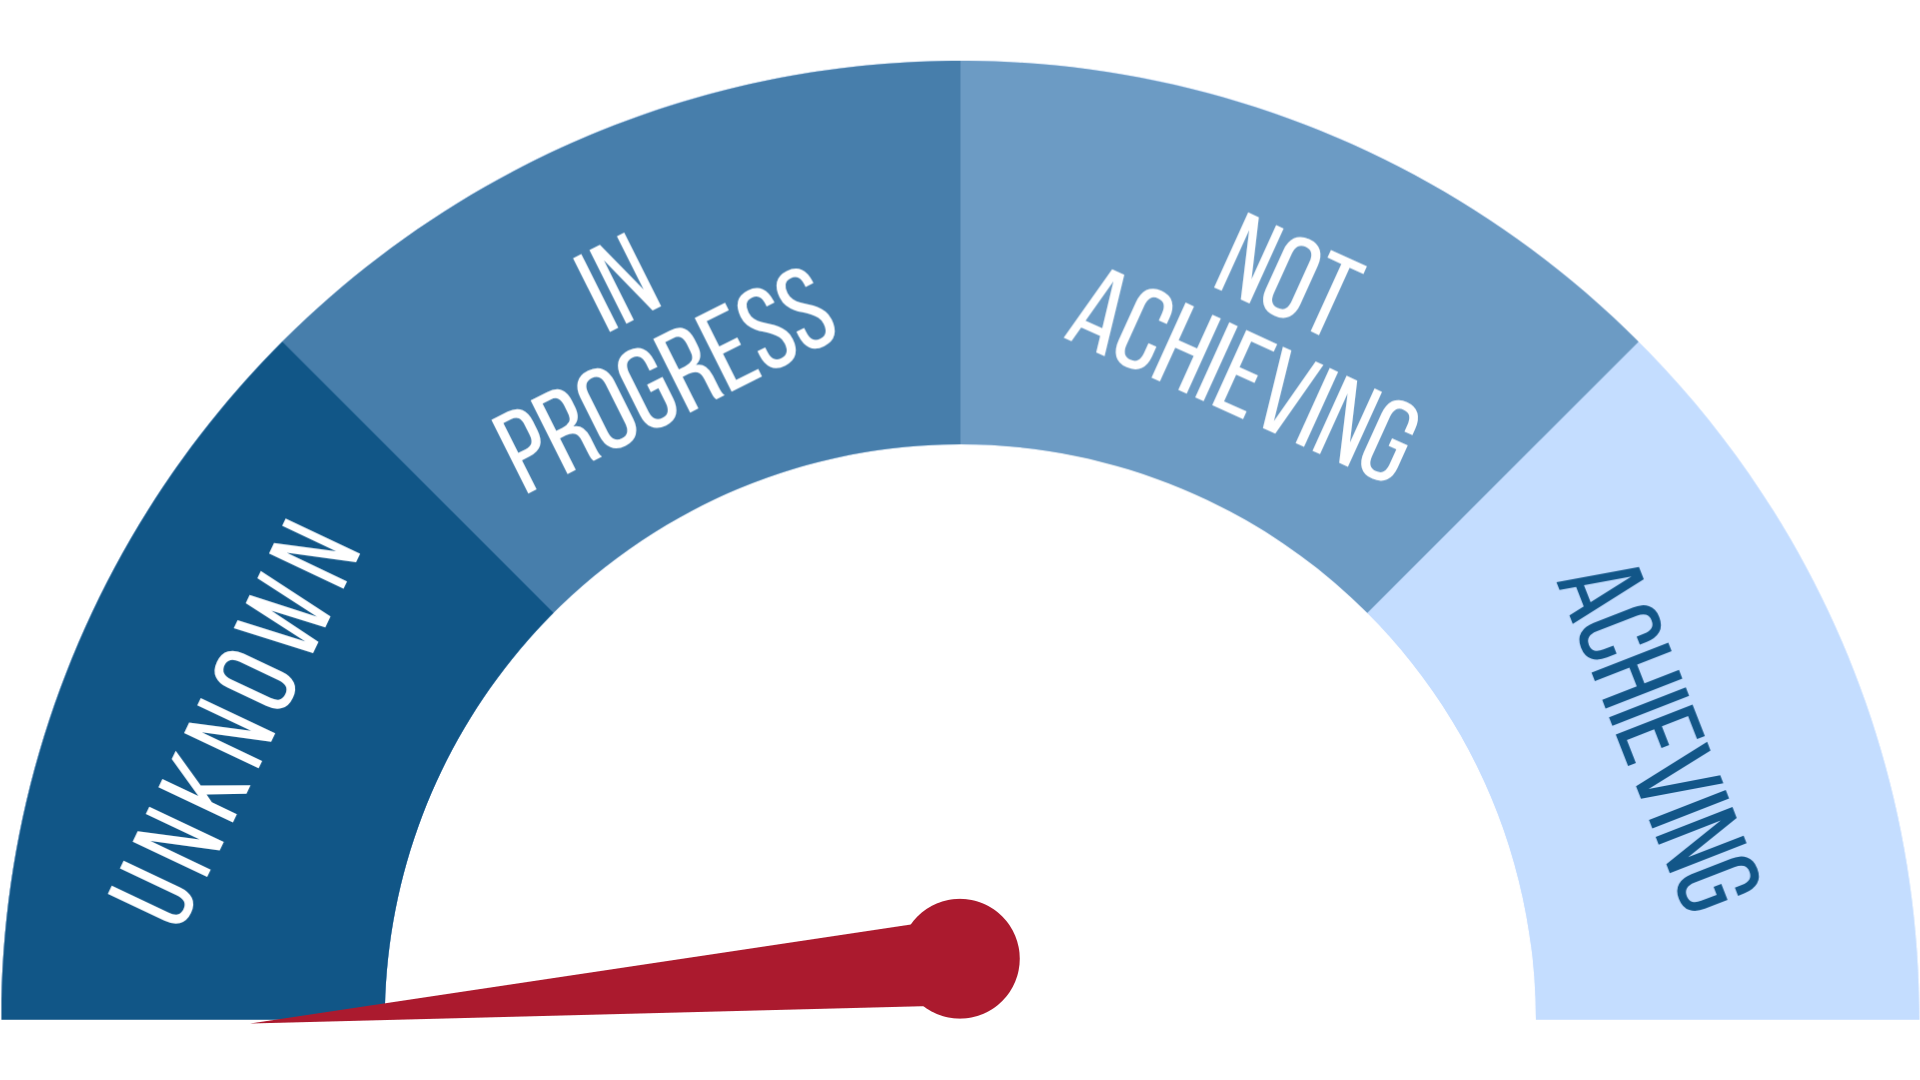
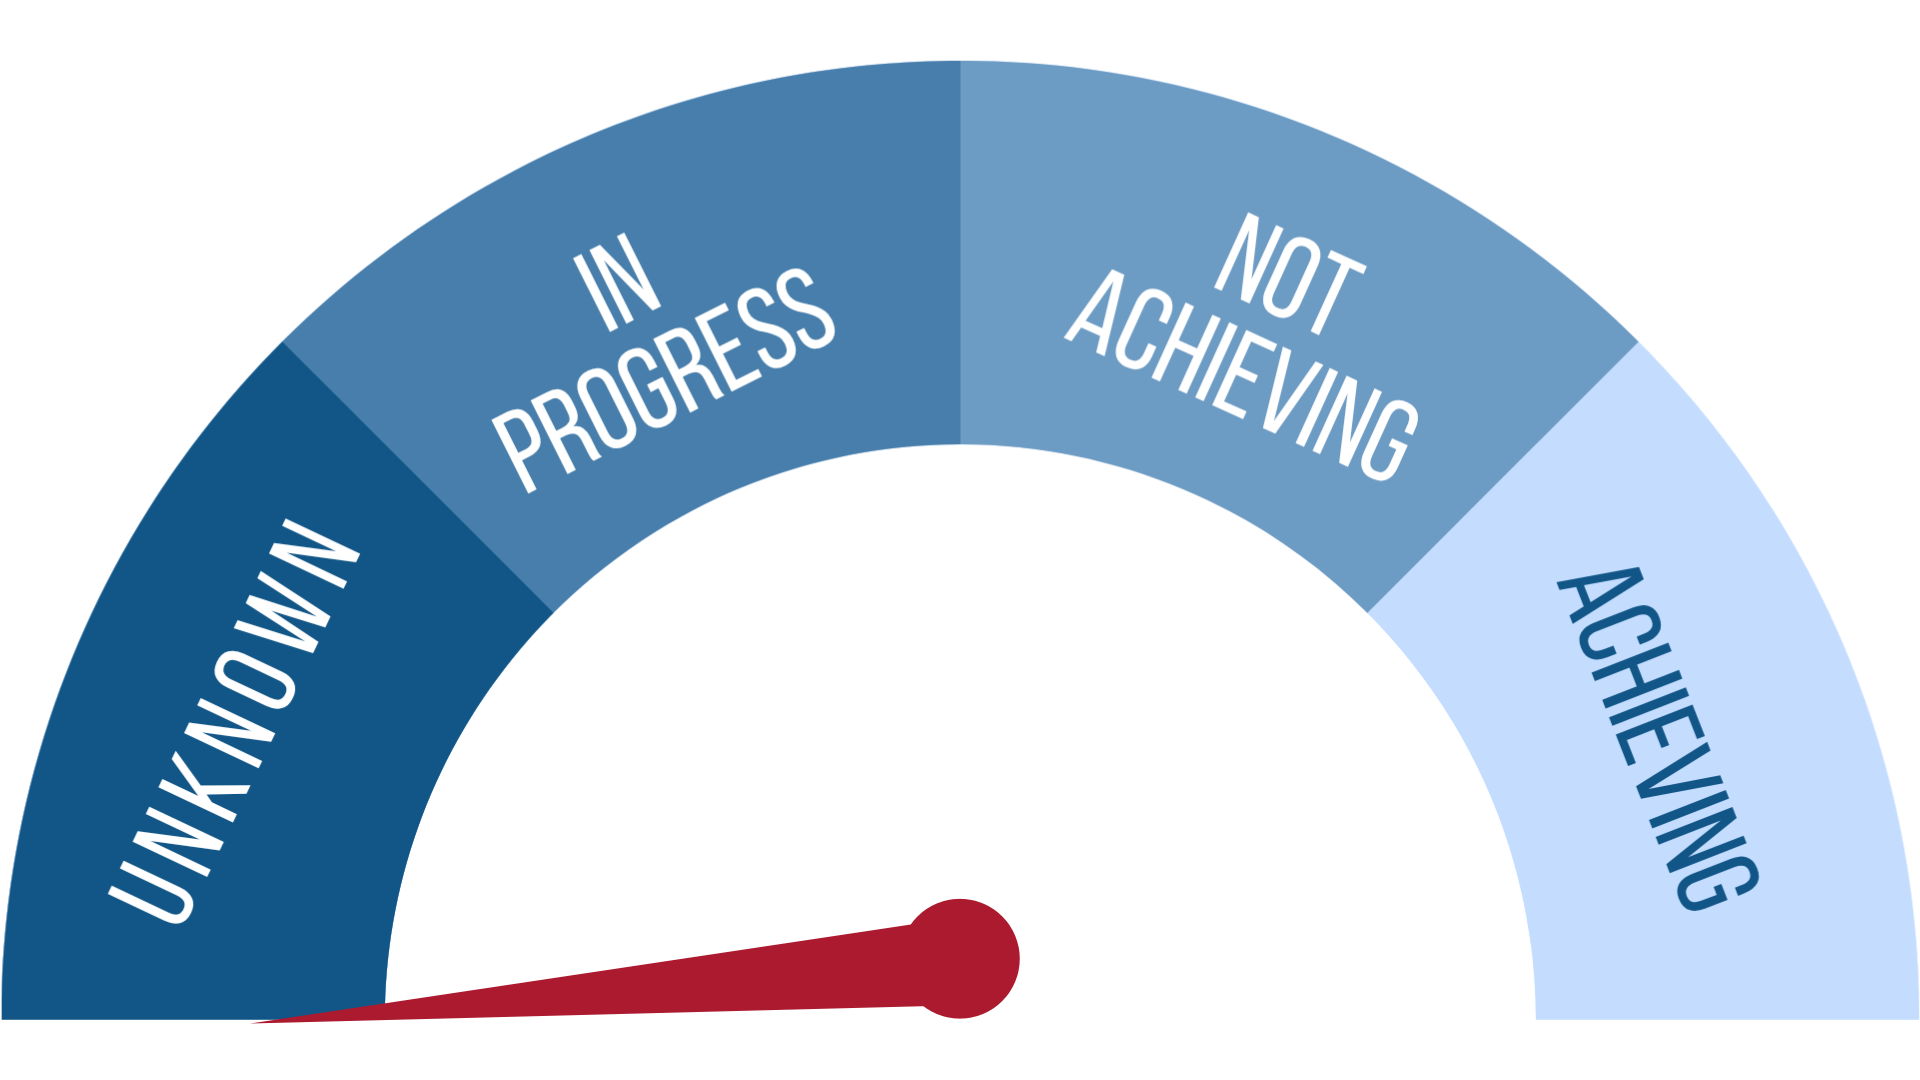
A status gauge is shown for each of the eight Ecosystem Targets. Determination of whether the target is being met is based on data available from 2021 through 2025.
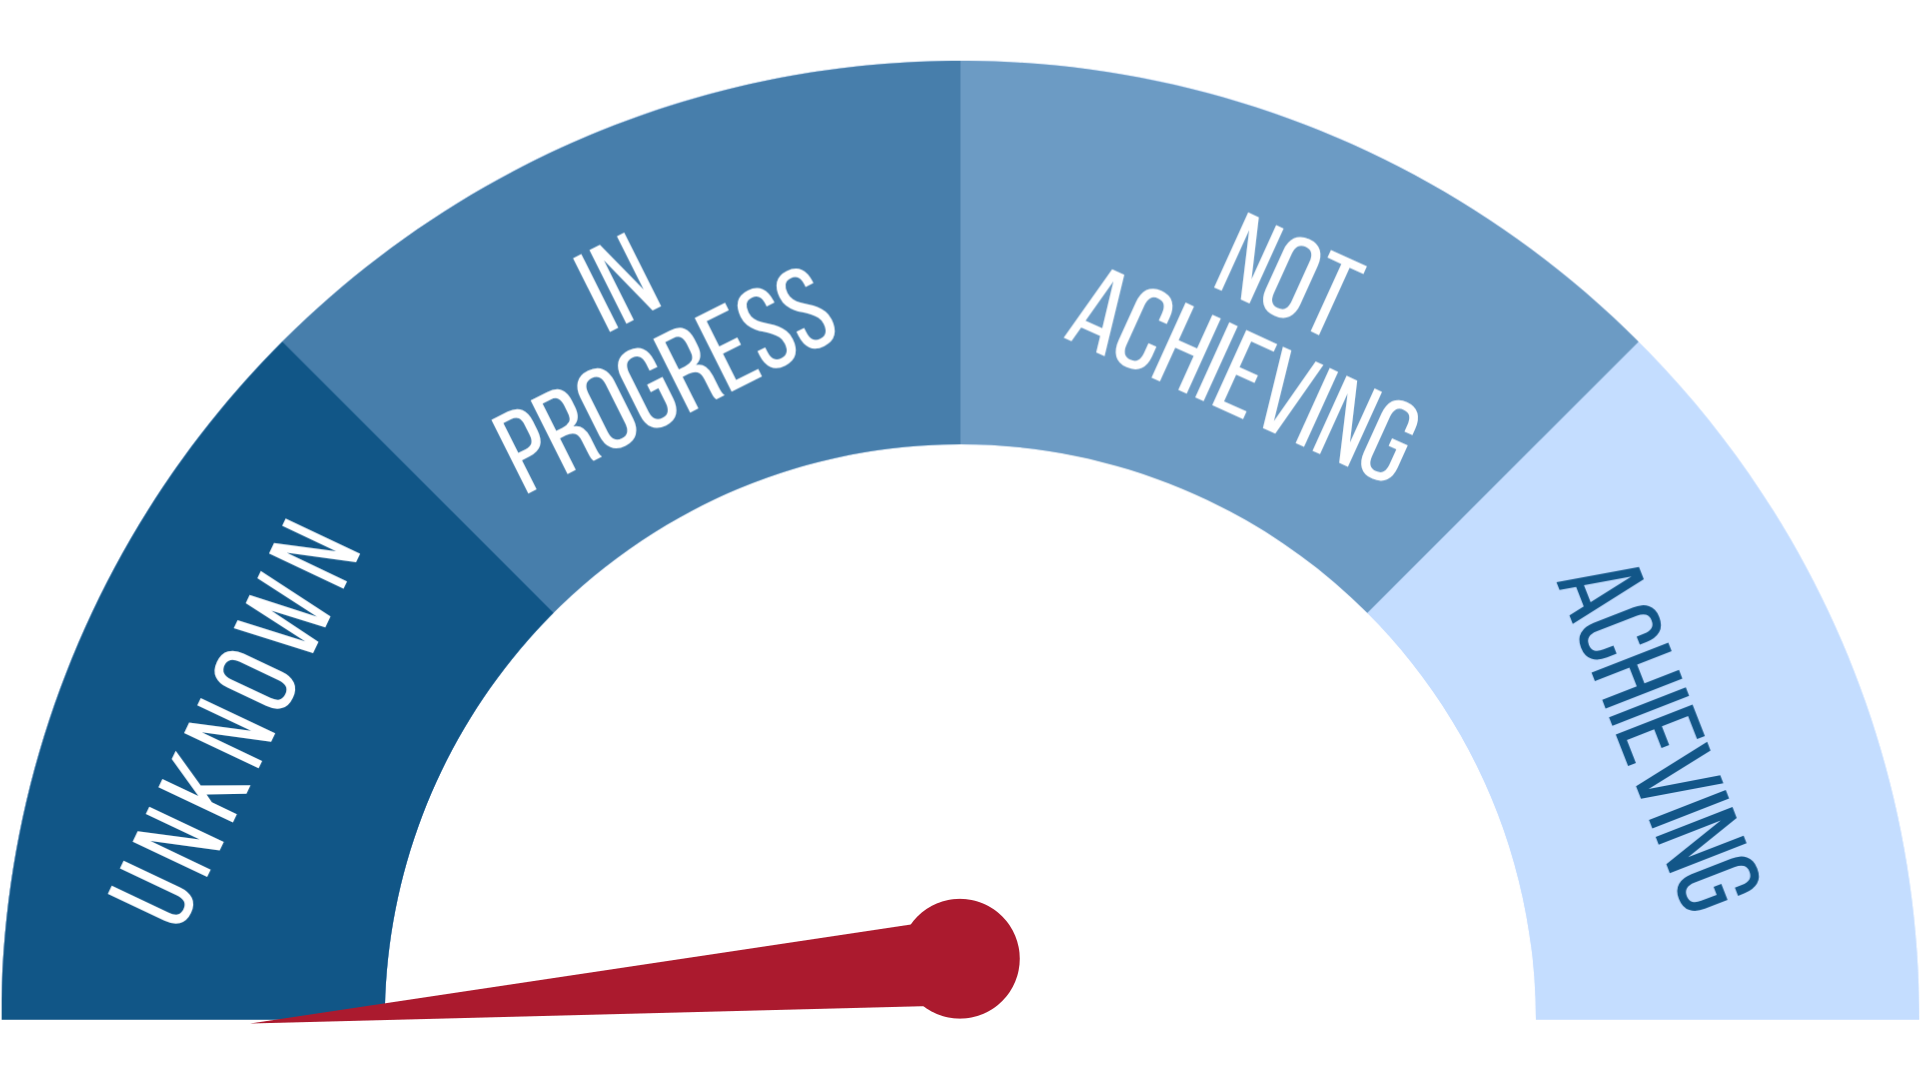
The status gauge is divided into four parts: Unknown, In Progress, Not Achieving, and Achieving. The needle points to the appropriate status for the indicator. A status of Unknown indicates that the current status is uncertain, either due to a lack of data or data that has not been updated recently.
“In Progress” status is given to indicators for which a significant amount of progress has been made during the reporting period toward achieving an unknown target or toward quantifying the status of the target. Not Achieving indicates that the target is not being met, while an Achieving status indicates that the target is currently being fully satisfied.
A list of what progress has been made and what investments are still needed has been provided for each target.
INTRODUCTION TO THE BAY
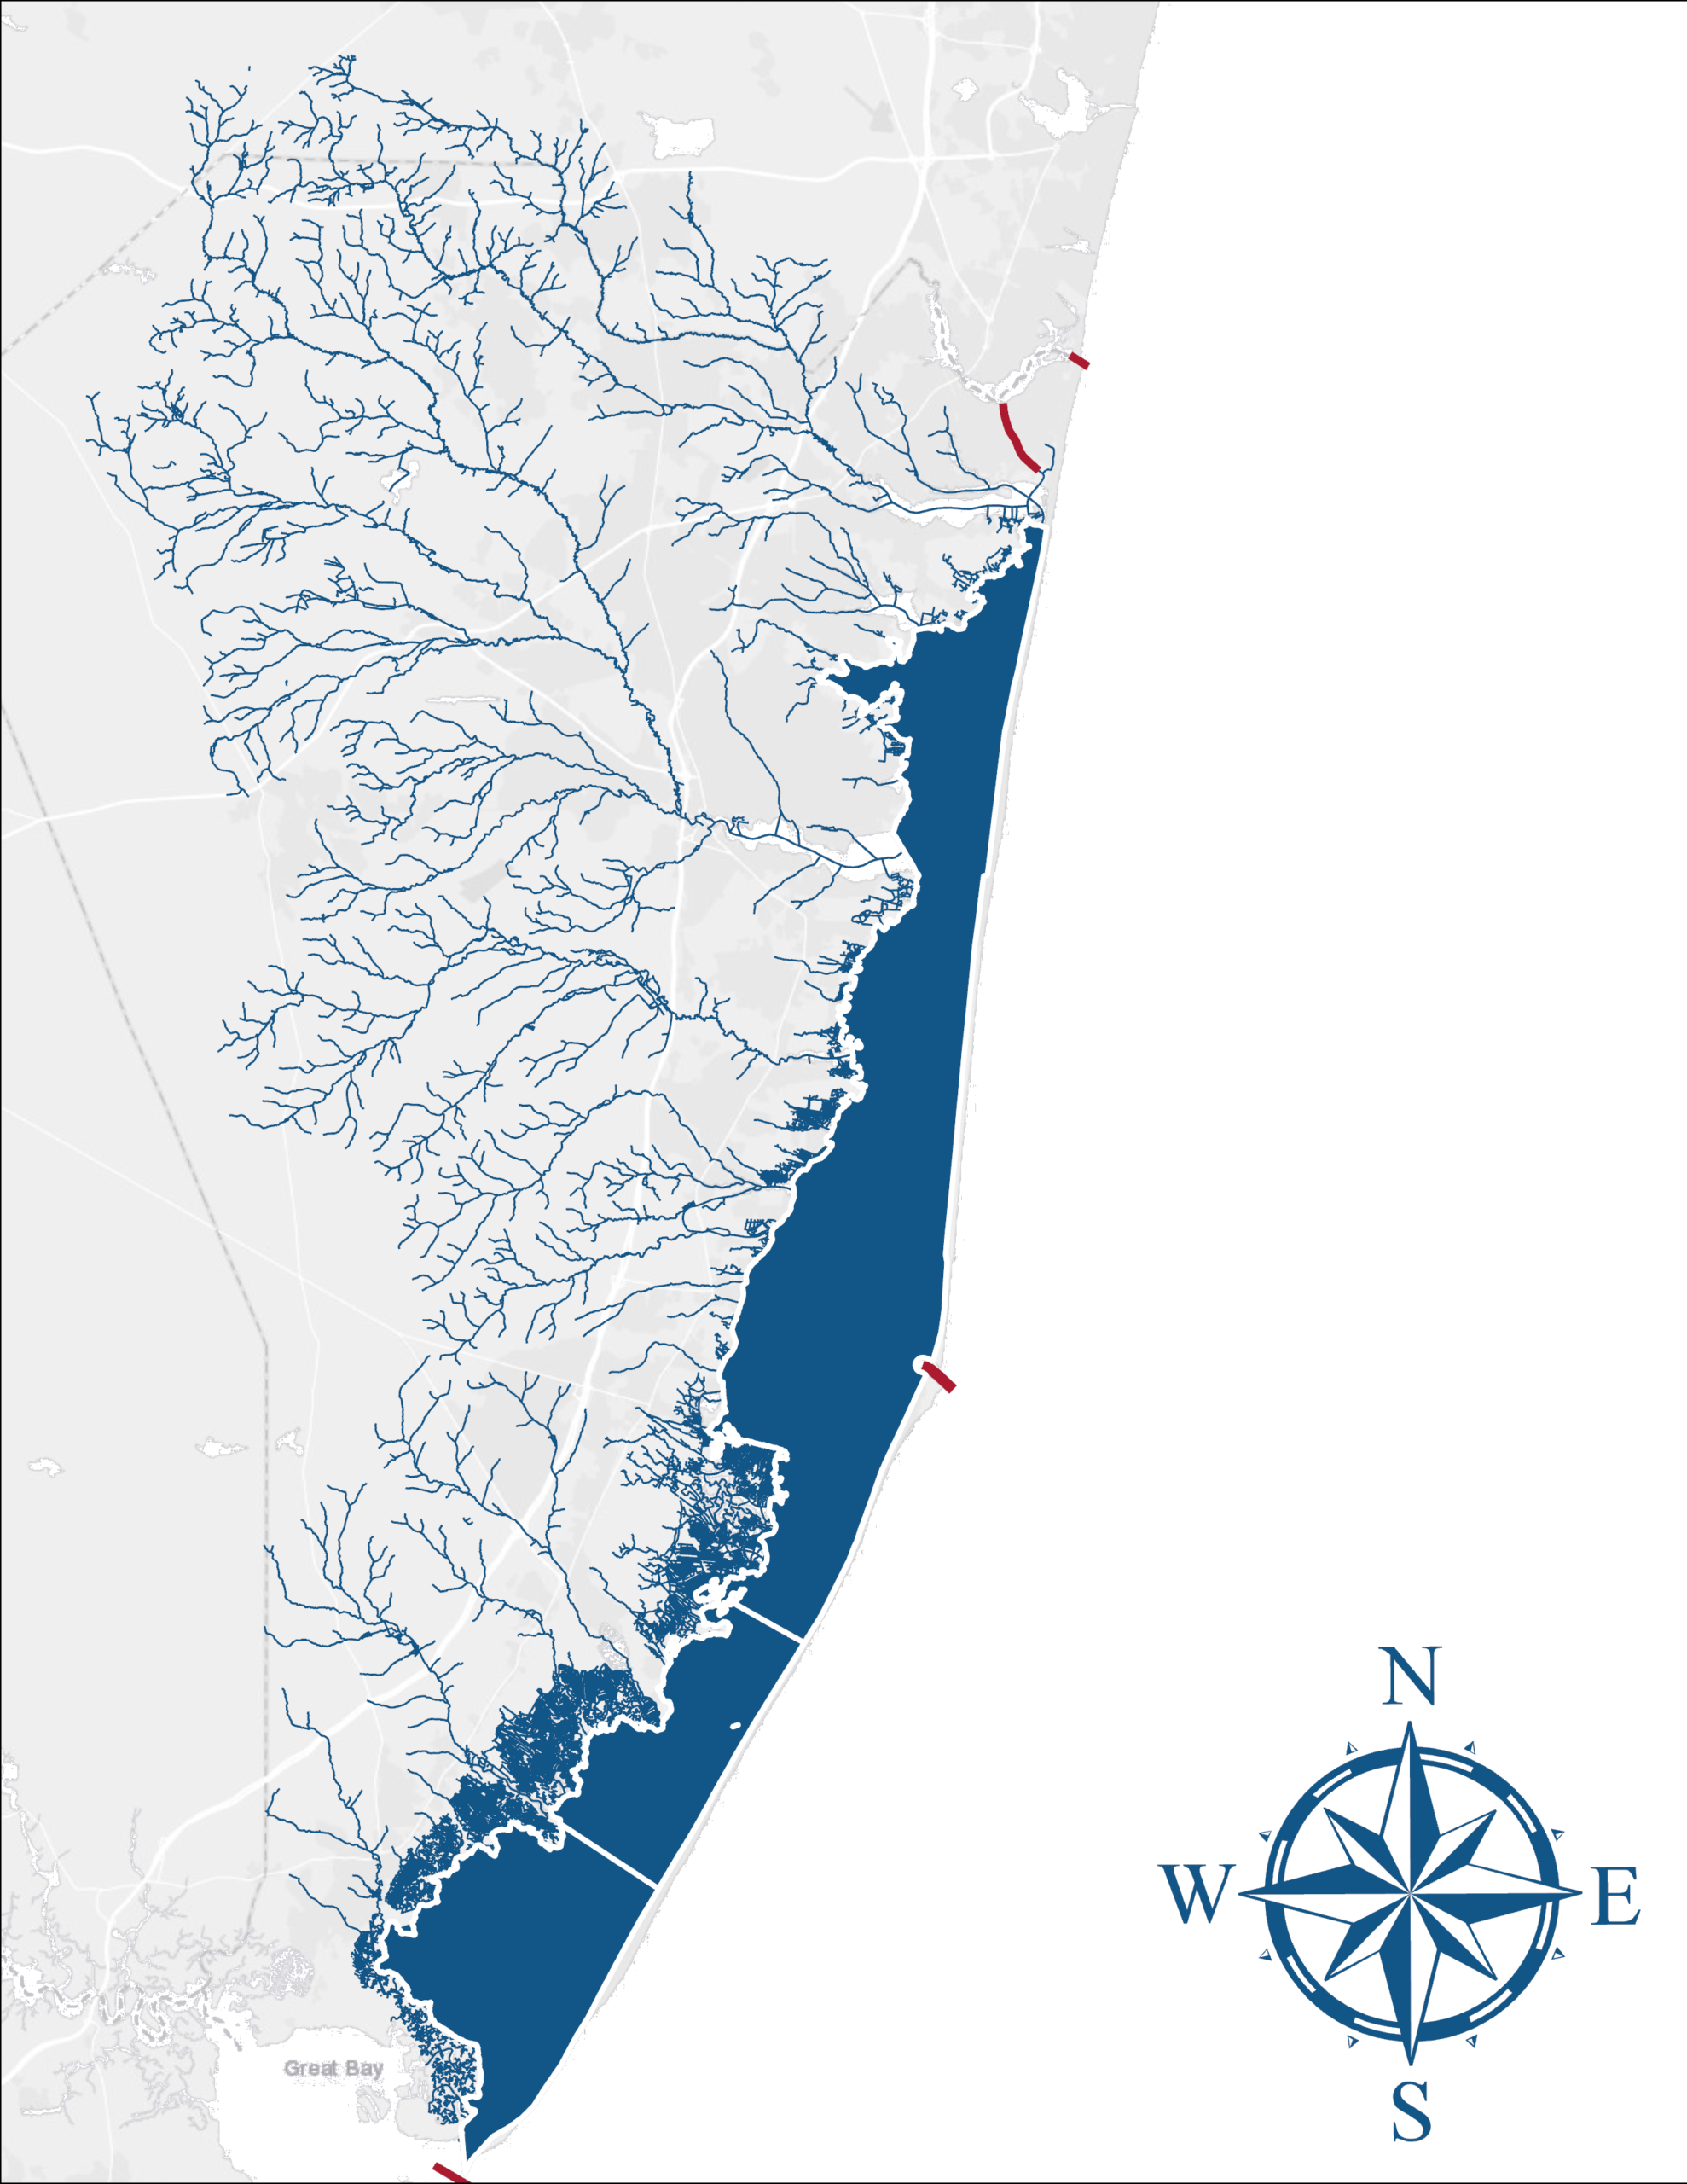
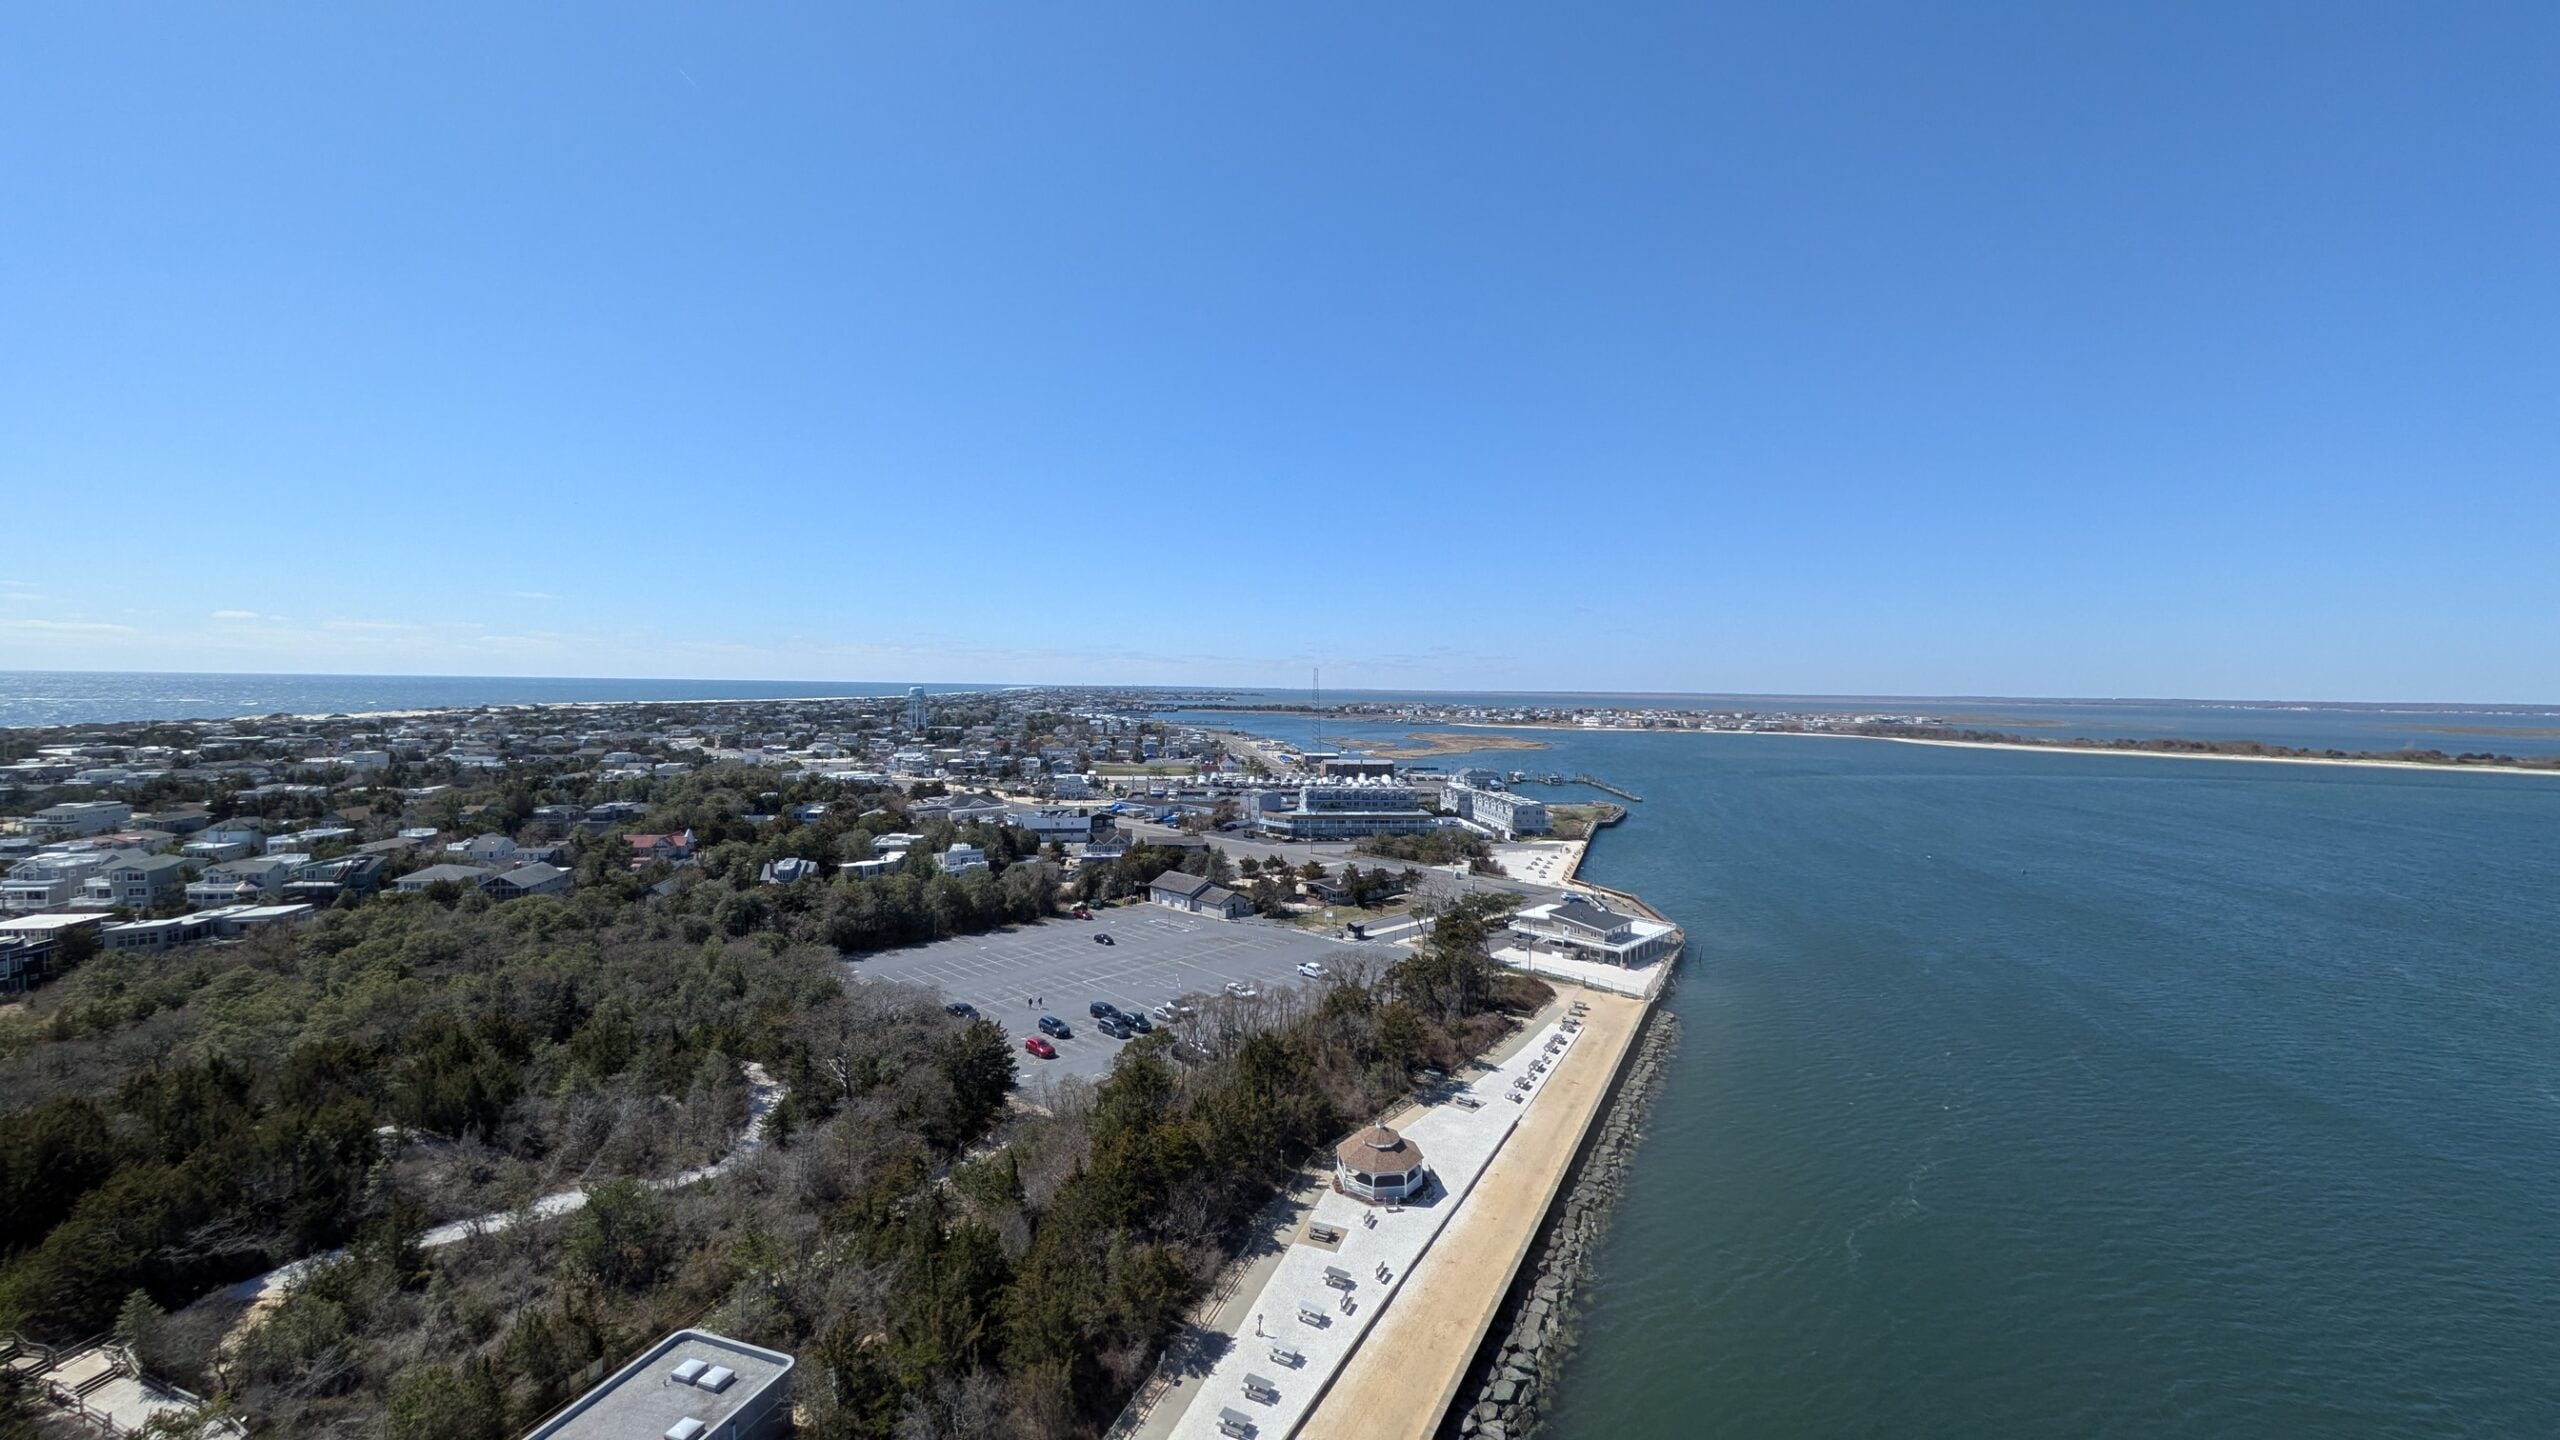
The 75-square-mile (194 km²) Barnegat Bay estuary comprises three shallow, micro-tidal bays: Barnegat Bay, Manahawkin Bay, and Little Egg Harbor. This coastal environment stretches over 42 miles in length from the Point Pleasant Canal on the northern end to Little Egg Harbor Inlet on the southern end, and is separated from the ocean by a nearly continuous barrier island complex of beaches, dunes, and wetlands.
The Barnegat Bay watershed encompasses more than 600 square miles of land draining into the 11 rivers and streams that empty into the Barnegat Bay-Manahawkin-Little Egg Harbor estuary. A significant source of freshwater for this aquatic network comes from tributaries within the New Jersey Pinelands and surrounding woodlands. From the headwaters of these streams, pristine freshwater flows eastward through predominantly forested areas along the coastal plain into the bay.
A nearly continuous barrier island complex runs along the eastern edge of the bay. Seawater enters the estuary through the Point Pleasant Canal via the Manasquan Inlet in the north, the Barnegat Inlet in the center, and the Little Egg Inlet to the south. This marine inflow mixes with freshwater from rivers, creeks, and groundwater, producing the diverse salinity zones critical for local wildlife and human activities alike. Geographically, the surrounding watershed encompasses most of Ocean County’s 33 municipalities, alongside four in Monmouth County and one in Burlington County. Consequently, environmental activities impacting the Manasquan River to the north and Great Bay to the south closely affect the entire basin.
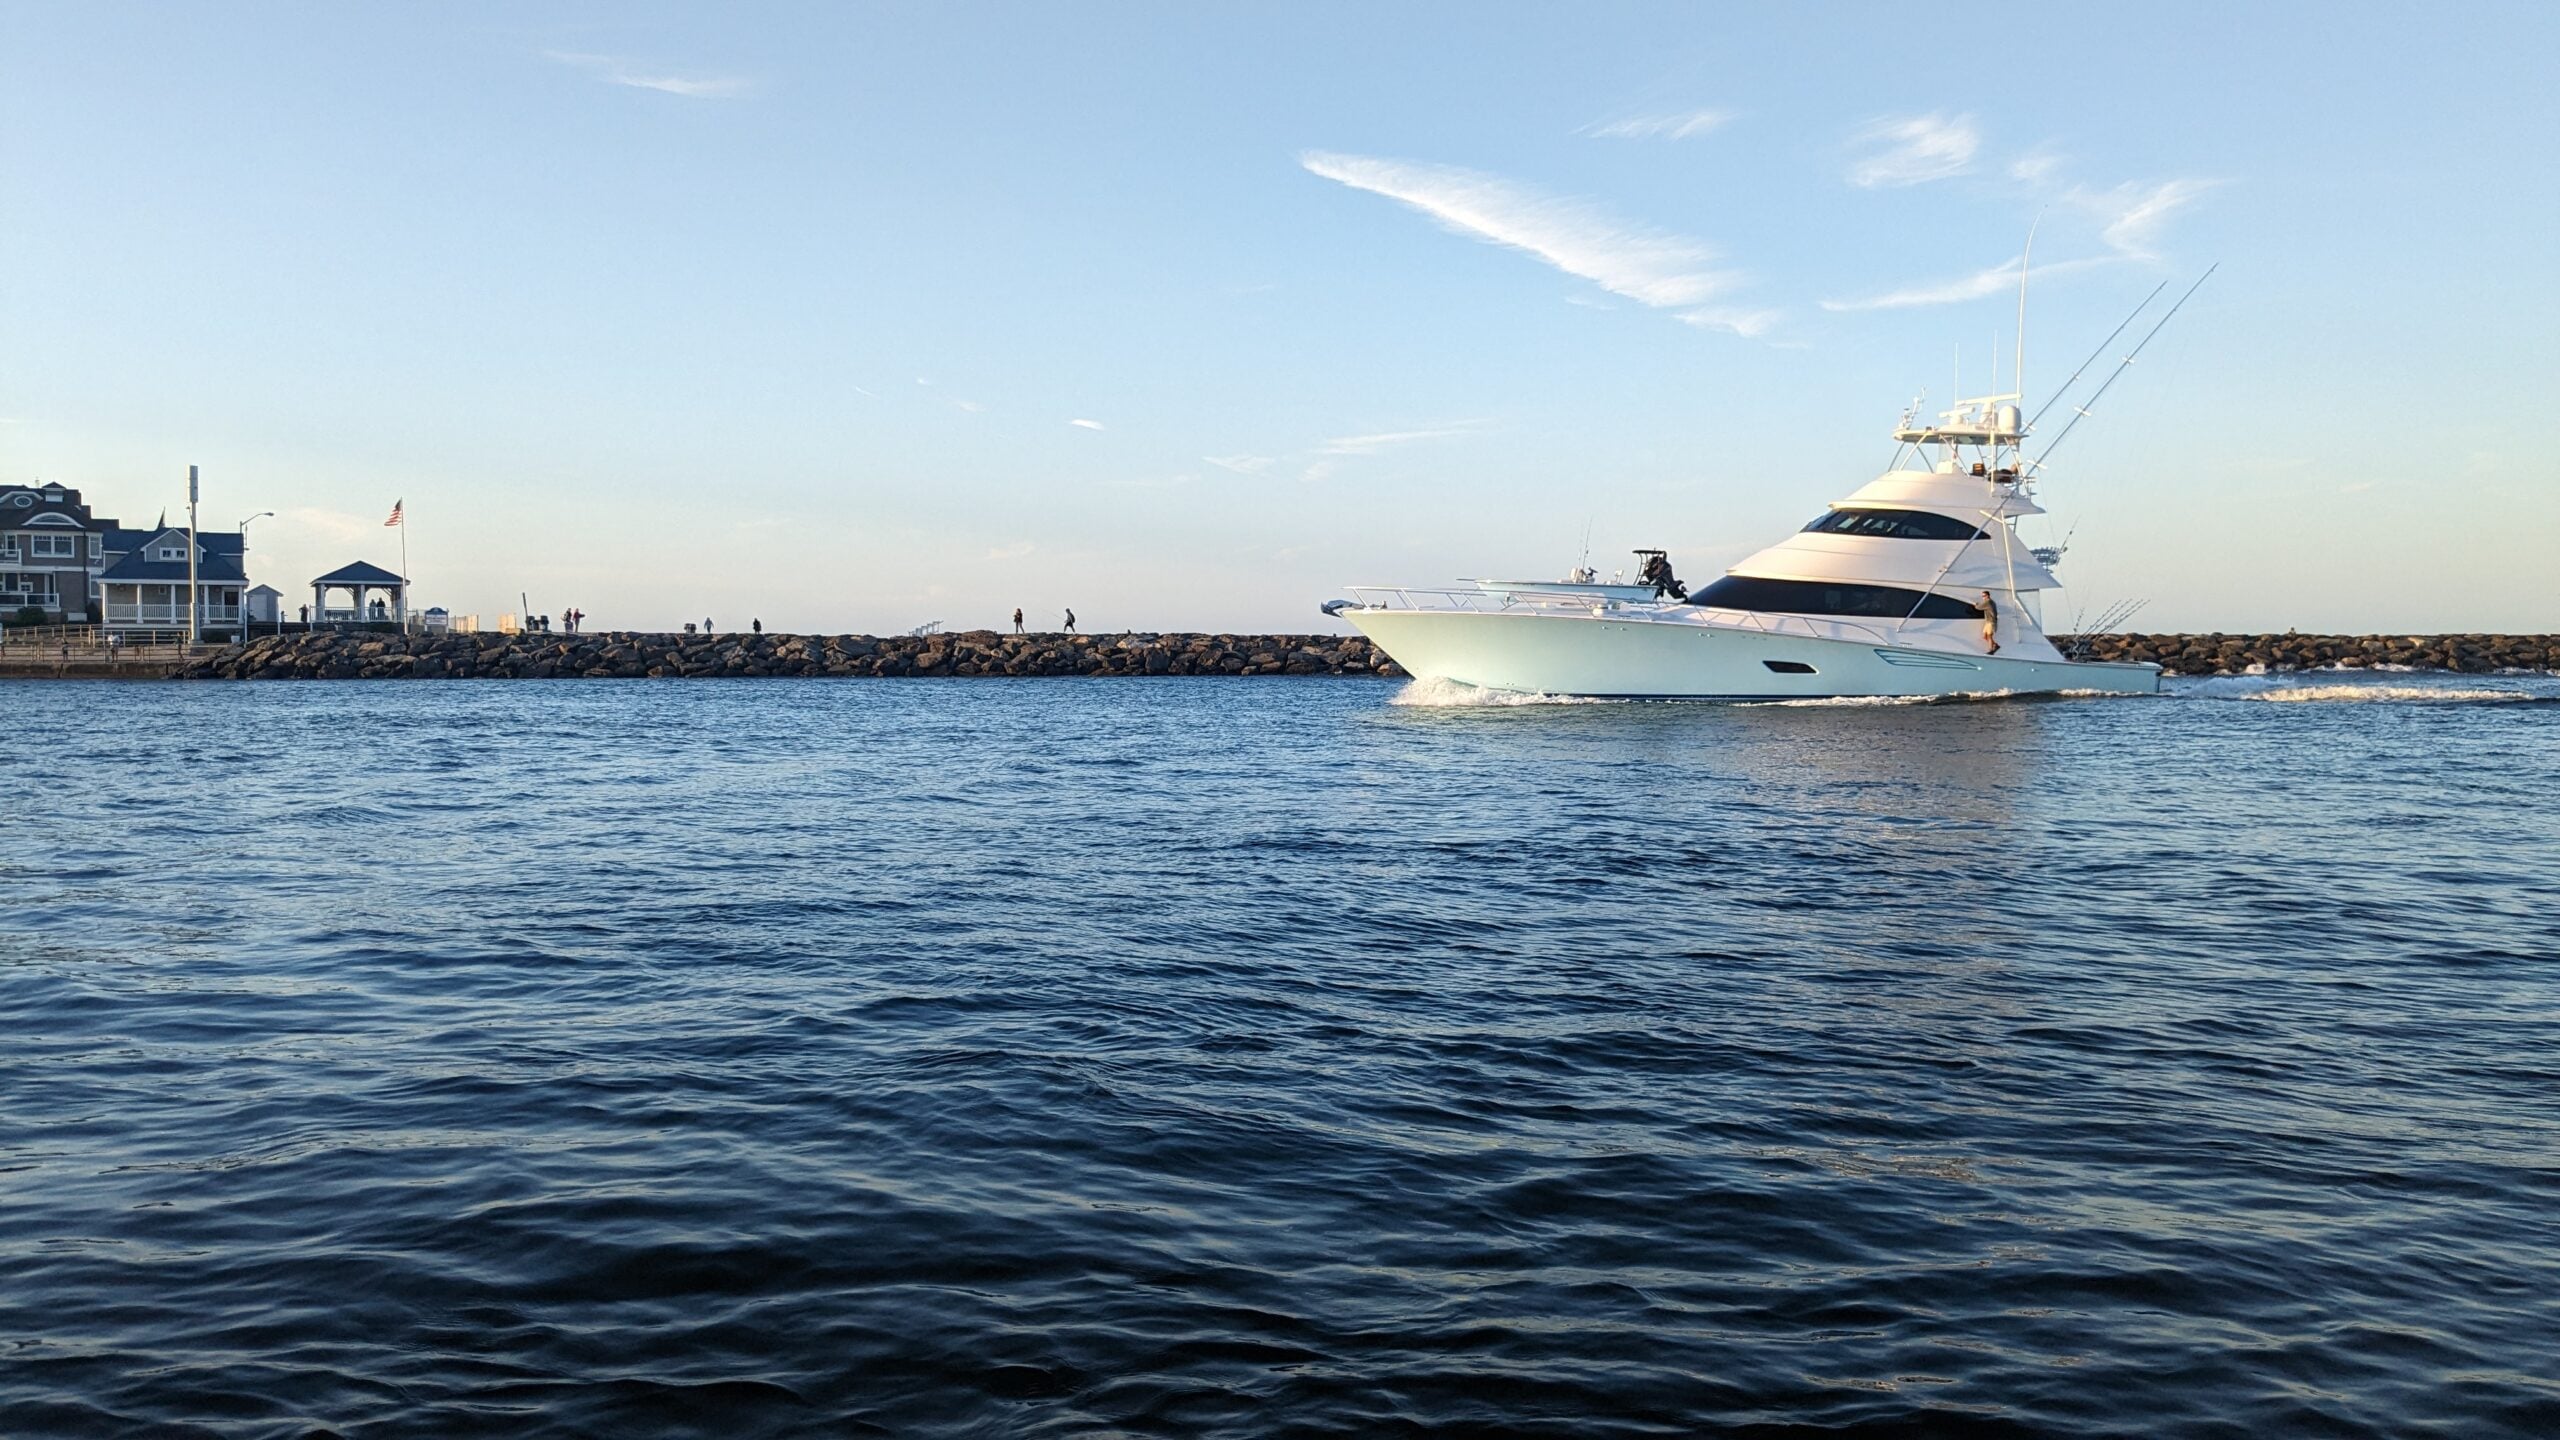
Manasquan Inlet
Point Pleasant Canal
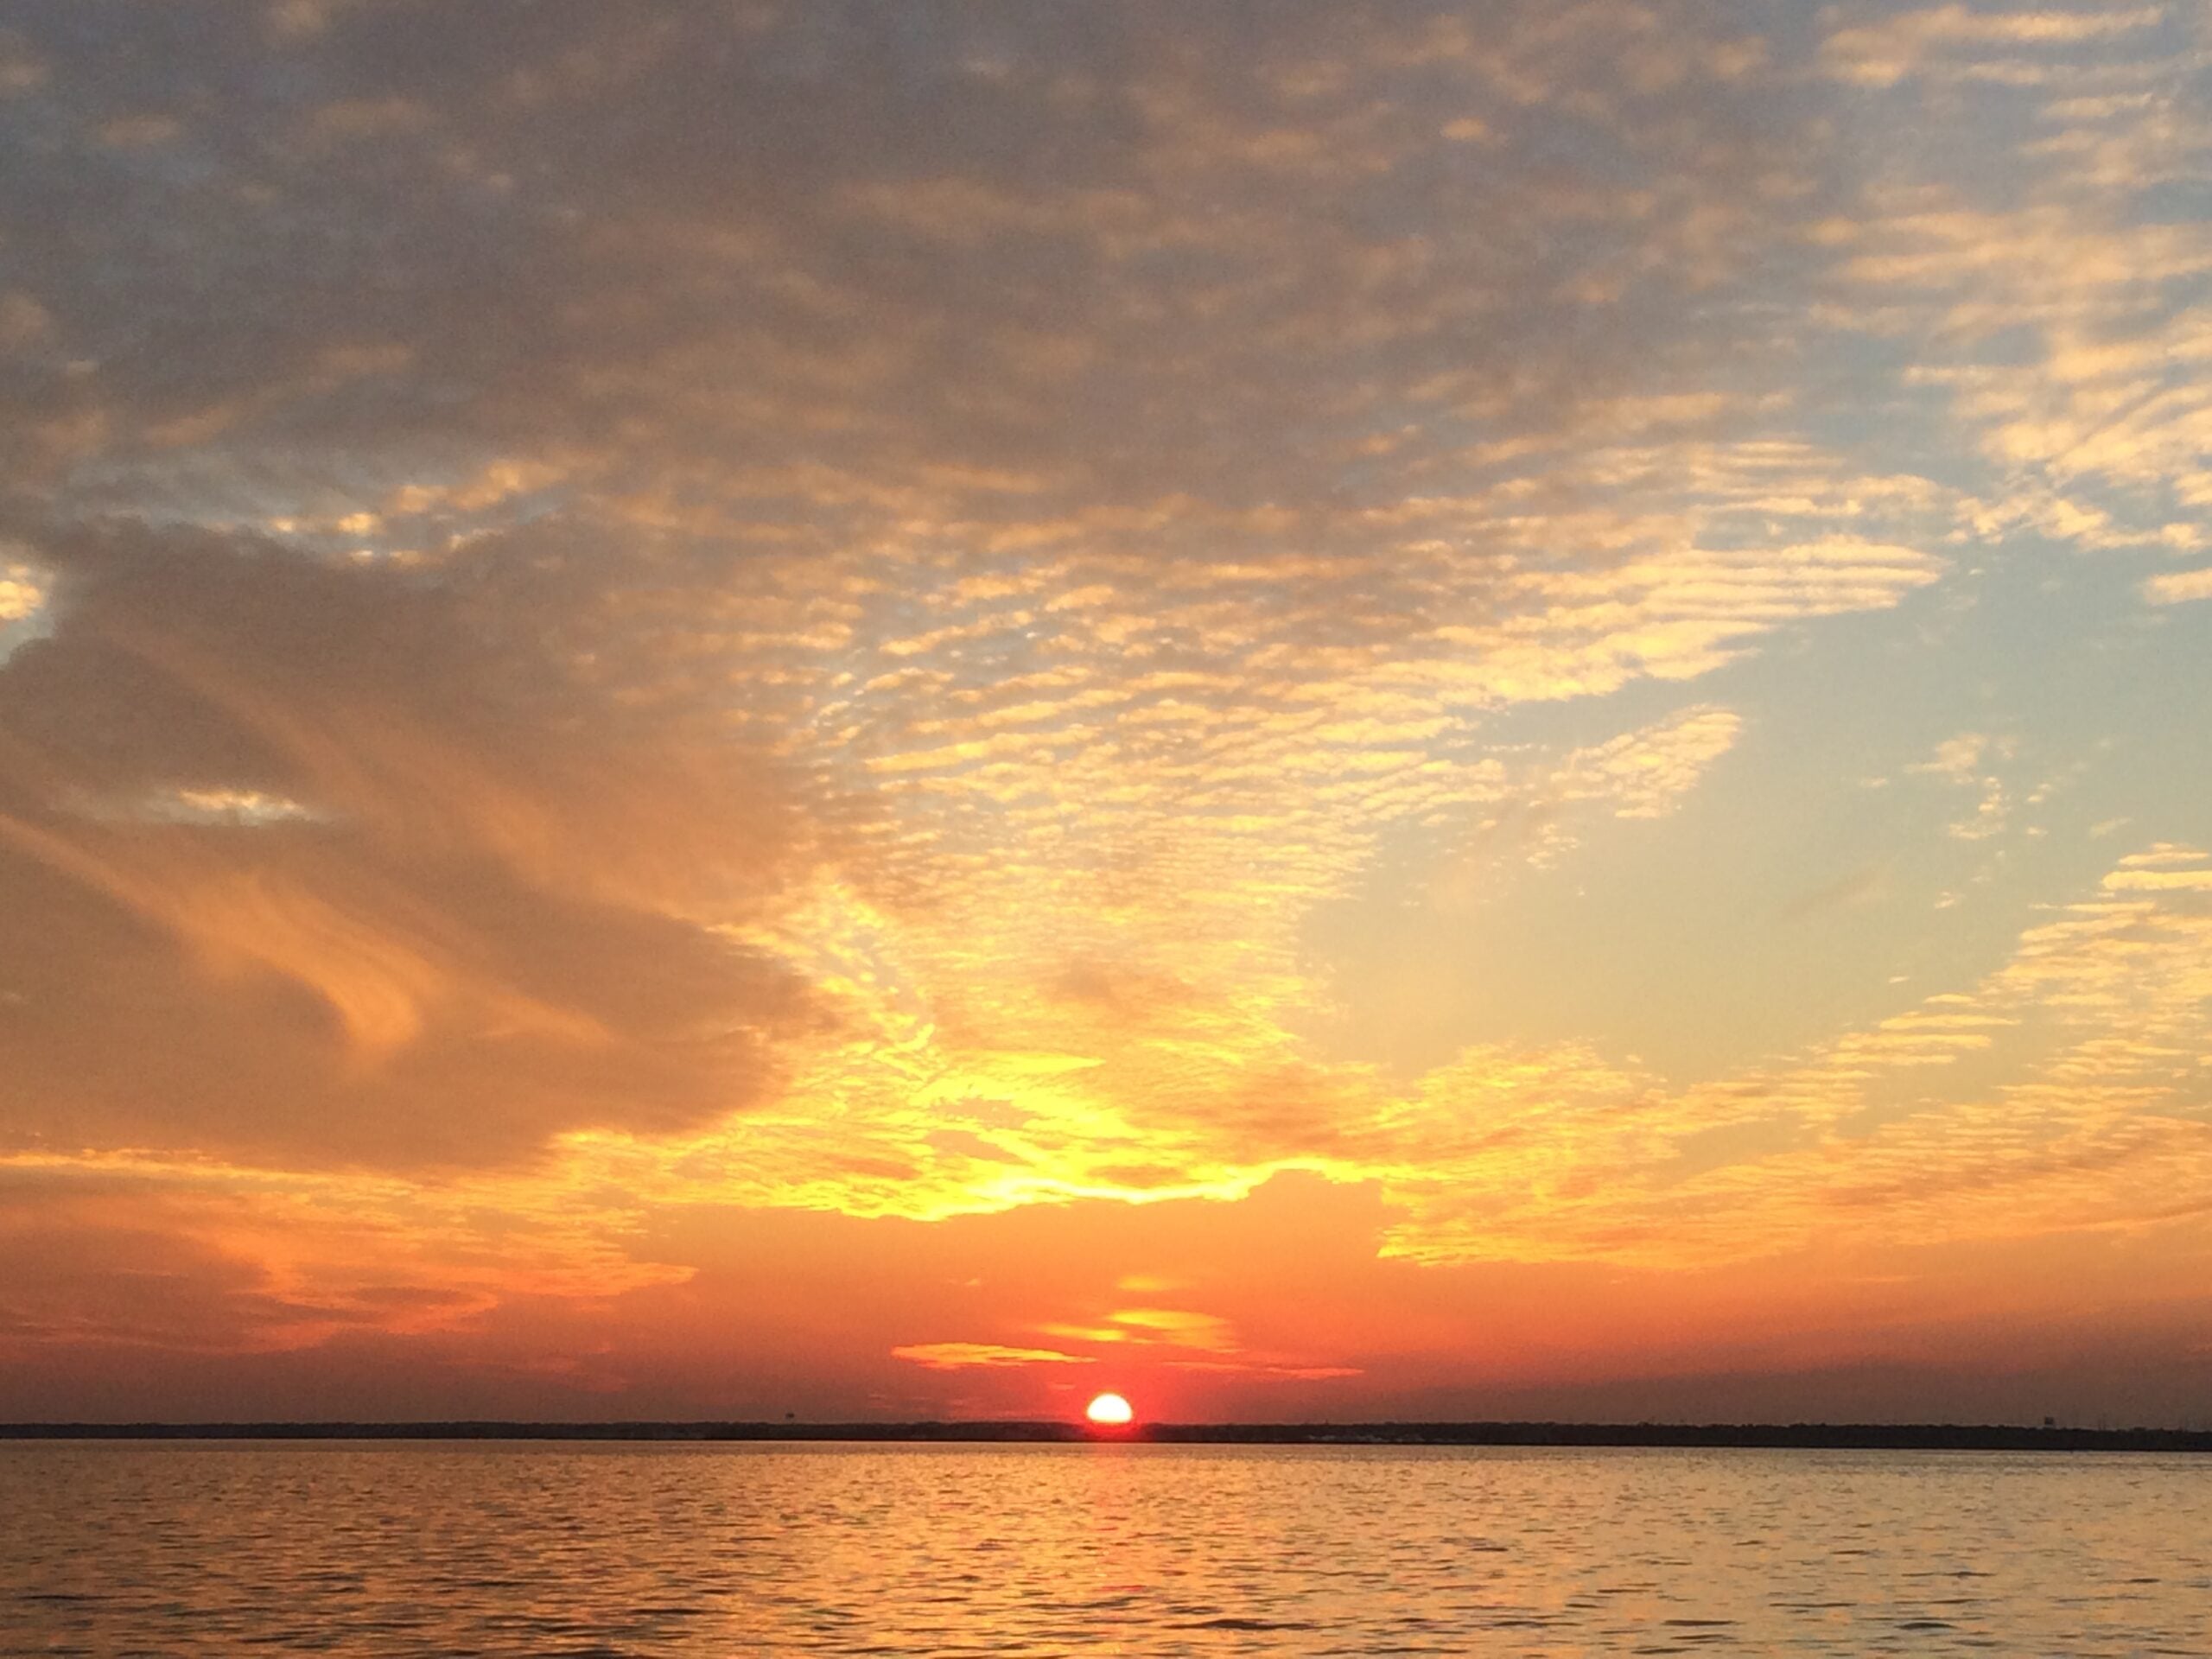
Barnegat Bay
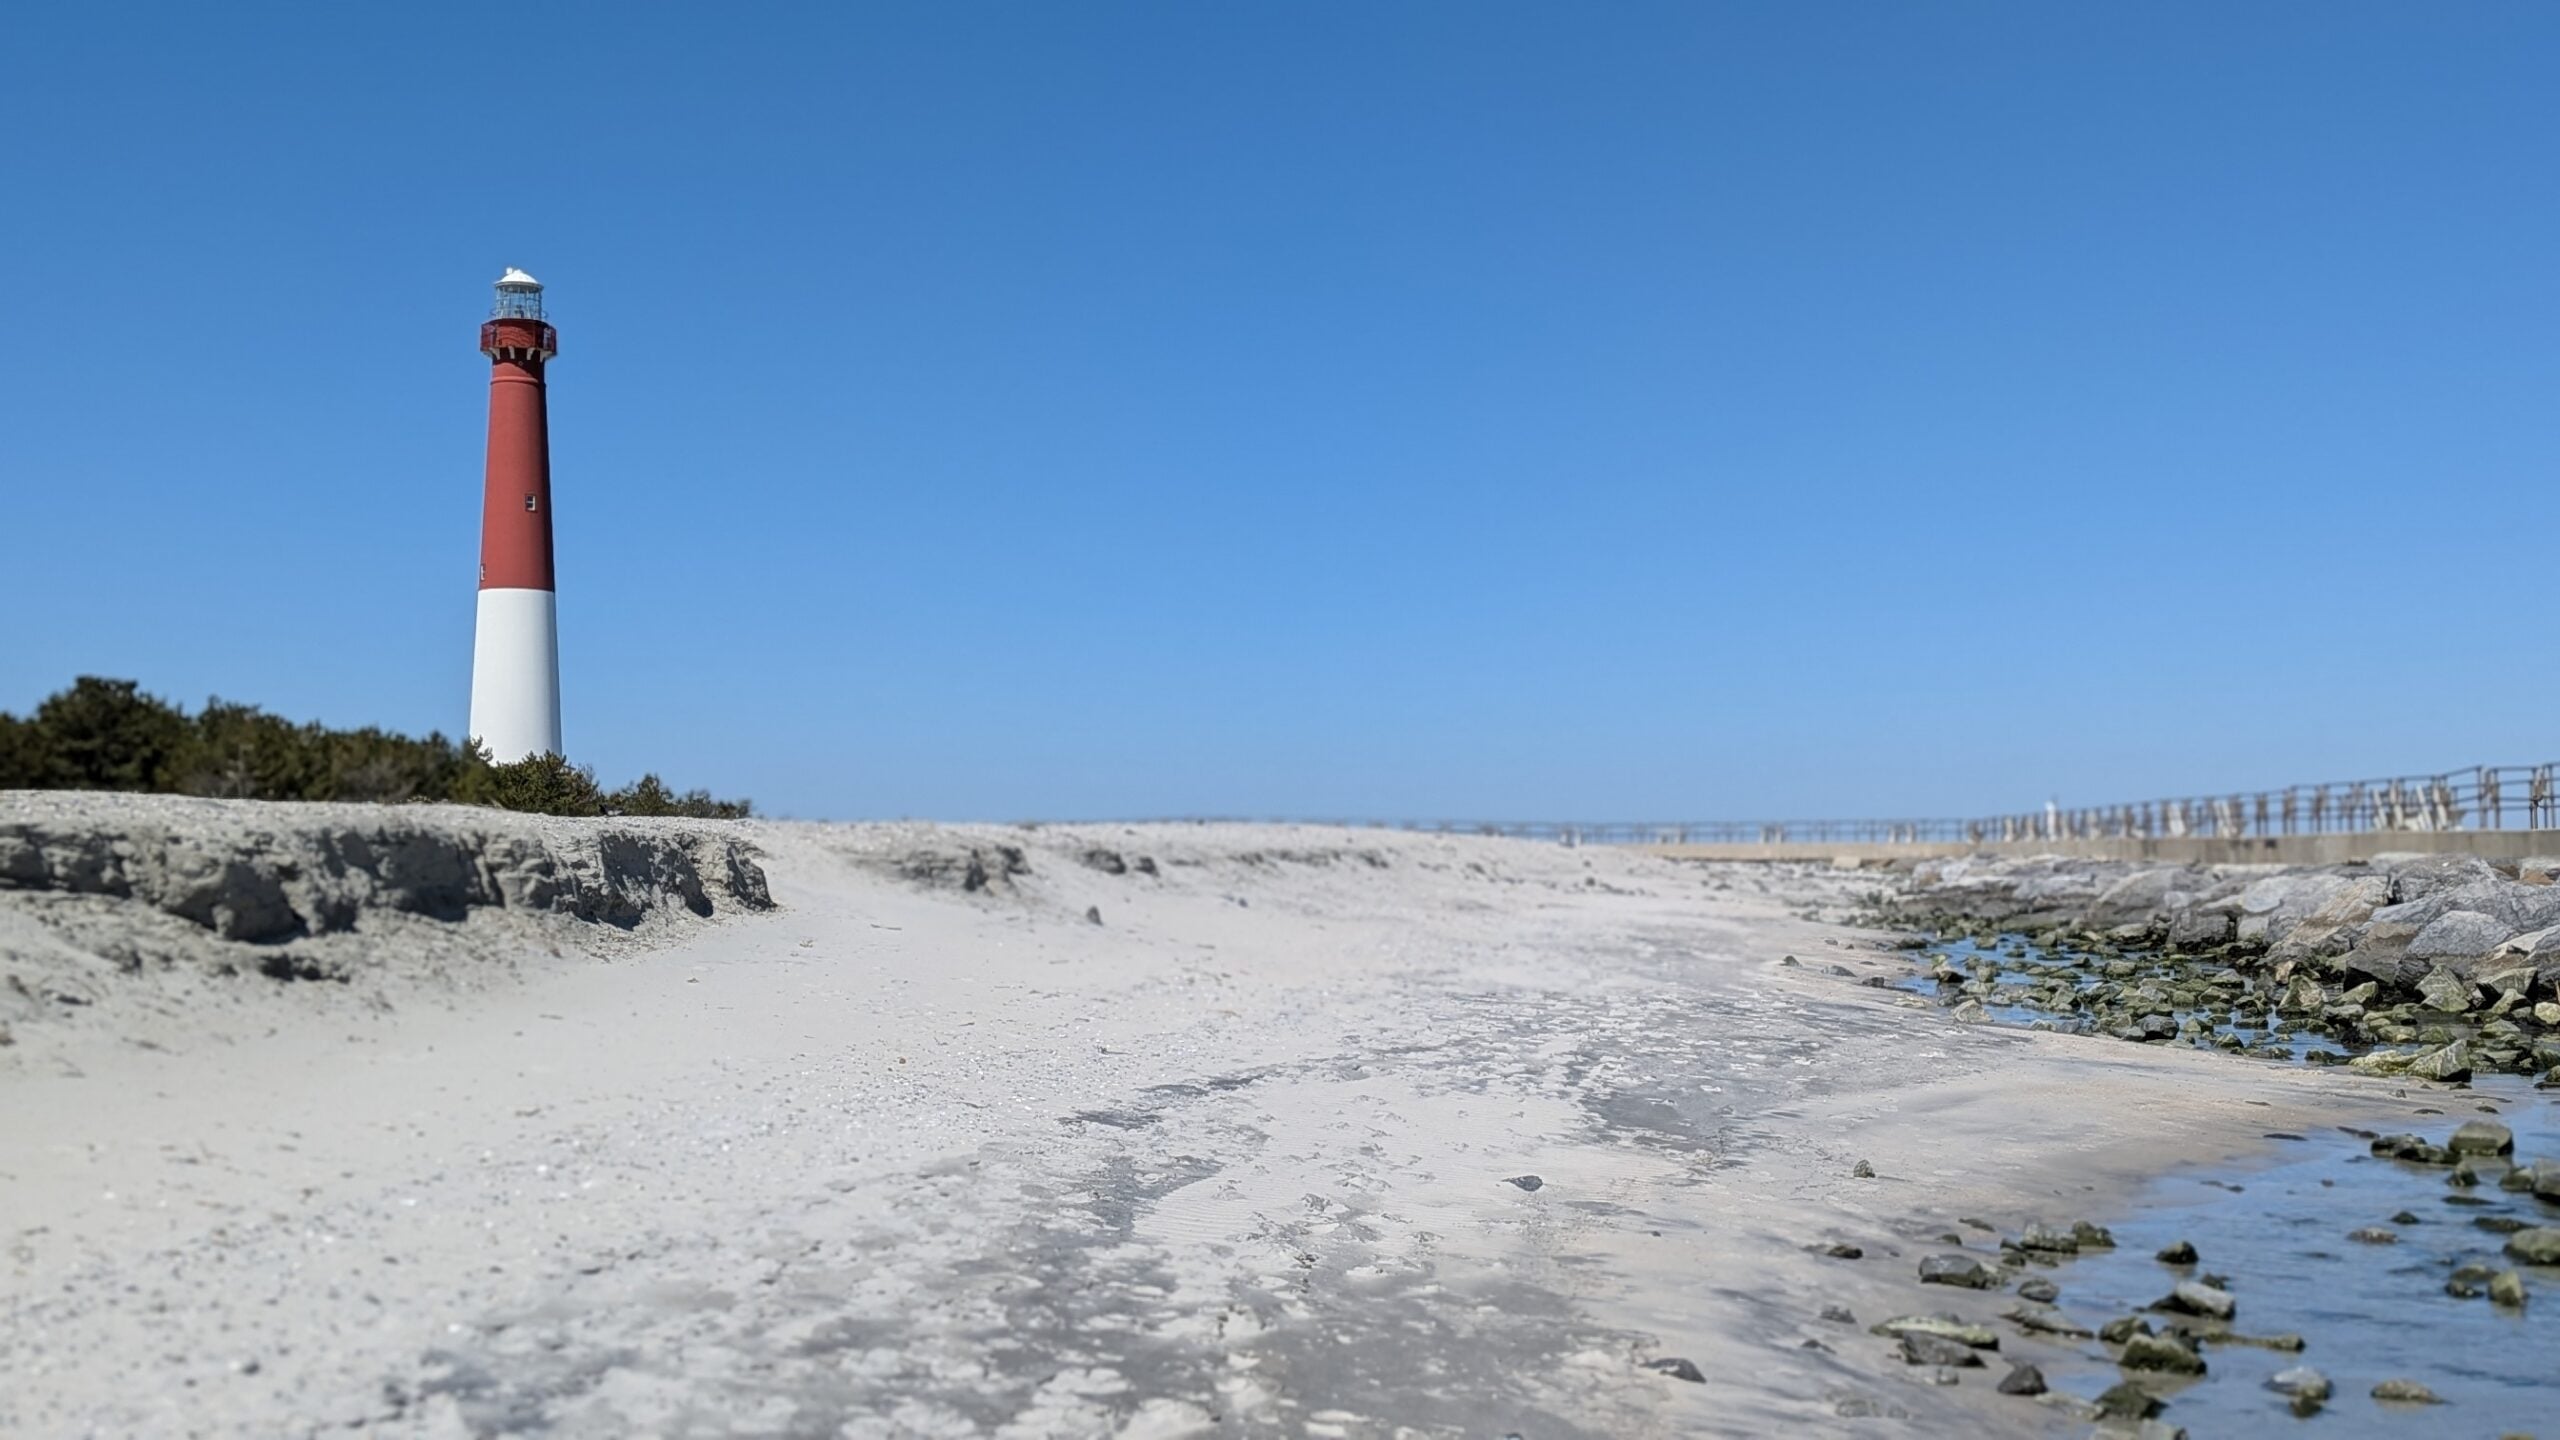
Barnegat Inlet
Manahawkin Bay
Little Egg Harbor
Little Egg Inlet
ECOSYSTEM-BASED MANAGEMENT
Rather than addressing issues or species in isolation, the 2021 CCMP adopts an ecosystem-based management approach. This framework protects and manages natural resources by evaluating the interconnected components of the environment and their dynamic interactions. Through this methodology, resource managers, researchers, policymakers, elected officials, and residents collaborate to diagnose and resolve complex environmental challenges. By examining the multiple compounding causes or modifiers of a given problem, decision-makers can better evaluate how natural processes and human activities collectively impact the environment, ultimately yielding more holistic solutions.
ECOSYSTEM TARGETS
Ideally, ecosystem-based targets are broad, with each individually integrating environmental improvements across four key priority areas: Water Quality, Water Supply, Living Resources, and Land Use. Developed by specialized expert panels, the Barnegat Bay targets focus on metrics rooted in established monitoring programs and existing datasets. These panels analyzed historical data for each target to provide guidance on realistic “stretch” goals based on prior watershed achievements. Ultimately, the eight final targets aim not only to protect against future environmental degradation, but also to drive the measurable restoration of these natural resources. Over the next 20 years, the BBP will collaborate alongside its partners to fulfill these vital ecological milestones.
THE BARNEGAT BAY PARTNERSHIP- A NATIONAL ESTUARY PROGRAM
In response to growing concerns over the health of Barnegat Bay and in recognition of its immense economic value, the New Jersey Legislature mandated a study in 1987 to analyze the impacts of regional development on the bay and its watershed. The findings prompted New Jersey Governor Christine Todd Whitman to submit an application to the U.S. Environmental Protection Agency (USEPA) in March 1995. This application successfully nominated Barnegat Bay to be recognized as an estuary of national importance and integrated into the National Estuary Program (NEP).
Congress established the NEP in 1987 under Section 320 of the Clean Water Act (33 U.S.C. §1330) to identify, restore, and protect nationally significant estuaries across the United States. In July 1995, the USEPA accepted the state’s nomination, officially designating the Barnegat Bay Estuary as one of only 28 estuaries of national significance.A nearly continuous barrier island complex runs along the eastern edge of the bay. Seawater enters the estuary through the Point Pleasant Canal via the Manasquan Inlet in the north, the Barnegat Inlet in the center, and the Little Egg Inlet to the south. This marine inflow mixes with freshwater from rivers, creeks, and groundwater, producing the diverse salinity zones critical for local wildlife and human activities alike. Geographically, the surrounding watershed encompasses most of Ocean County’s 33 municipalities, alongside four in Monmouth County and one in Burlington County. Consequently, environmental activities impacting the Manasquan River to the north and Great Bay to the south closely affect the entire basin.
In April 1996, the USEPA and the New Jersey Department of Environmental Protection (NJDEP) entered into a joint agreement, officially convening the Barnegat Bay National Estuary Program Management Conference. The primary directive of this collaborative group was to design a Comprehensive Conservation and Management Plan (CCMP) to rehabilitate and protect the bay. Approved by the USEPA in May 2002, the initial CCMP guided the organization’s conservation initiatives for nearly a decade.
Beyond establishing this management framework, Section 320 of the Clean Water Act chartered the Barnegat Bay Partnership (BBP). This coalition unites federal, state, county, municipal, academic, business, nonprofit, and private entities to protect the estuary. Over the years, the BBP has continuously monitored its progress toward the goals, objectives, and actions set forth in the 2002 plan, updating its priorities through consecutive Strategic Plans spanning 2008–2012 and 2012–2016. Between 2016 and 2020, the partnership undertook a thorough revision of its foundational framework. This effort culminated in a 2021 CCMP update that incorporates vital advancements in our ecological understanding and outlines modern strategies to safeguard water quality, water supply, habitats, and biotic resources.
As a statutory requirement for all NEPs under the Clean Water Act, the BBP produces a “State of the Bay Report” every five years. This publication details the status and trends of key indicators—such as water quality, natural resources, and public use—to help inform future CCMP updates. Previous iterations were completed in 2005, 2011, 2016, and 2021.
EXPLORE THE INDICATORS
You’re now entering the main report:
Scroll through or use the navigation header at top for each indicator to learn about the health of the Barnegat Bay watershed. Each section explains what is being measured, why it matters, and how conditions have changed over time.
Likewise, each graph that displays a “pointer” may be clicked and expanded for a larger, more in-depth view. Look for this symbol on applicable images and try it out:
PUBLIC BEACH CLOSURES
CCMP Priorities: Water Quality
TARGET
No beaches will exceed the safe swimming standard more frequently than their baseline exceedance percentage from 2016-2018.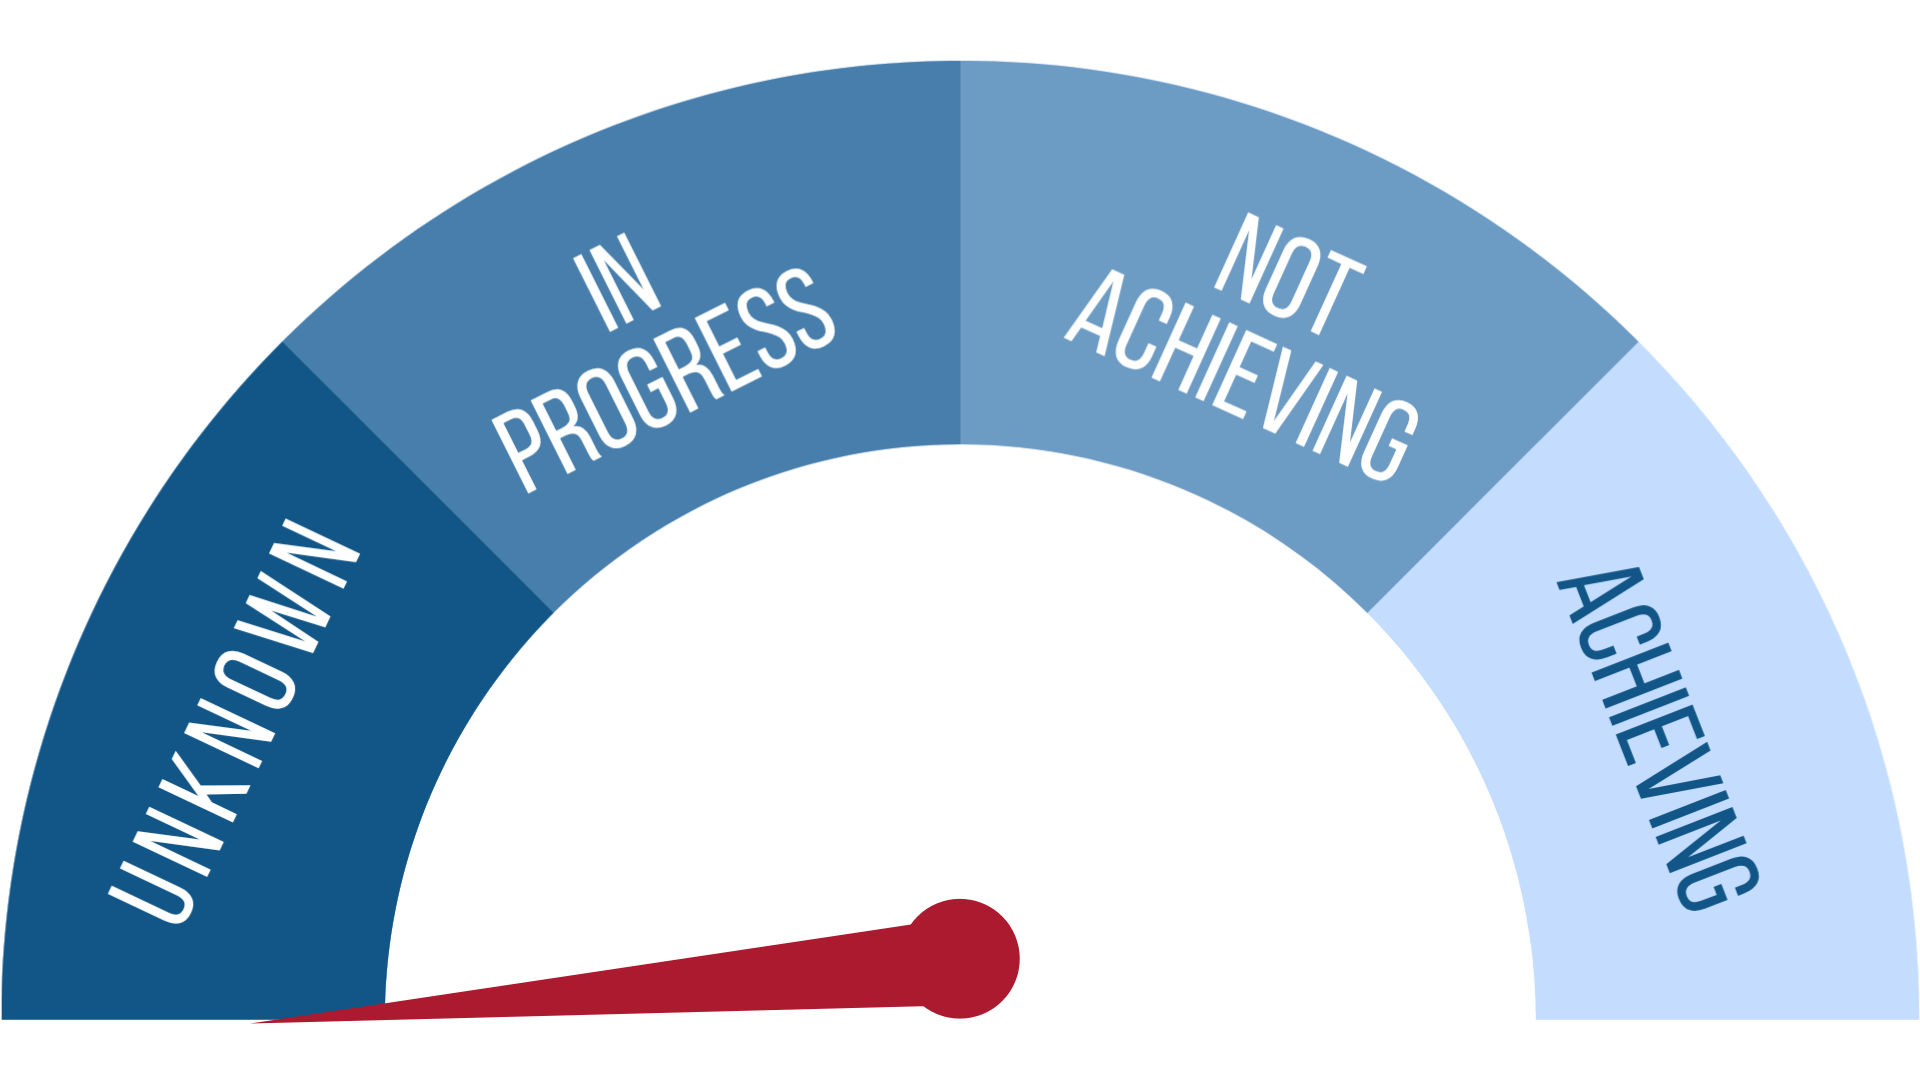
PROGRESS MADE
- Many beaches are consistently safe for swimming.
INVESTMENT NEEDS
- Beachwood, Hancock, Windward, and several lake beaches need additional track-down studies to pinpoint sources of bacteria.
- Unofficial but utilized beaches, such as in the Toms River, also need track-down studies to pinpoint sources of bacteria.
primary indicator: beach openings/closures
STATUS
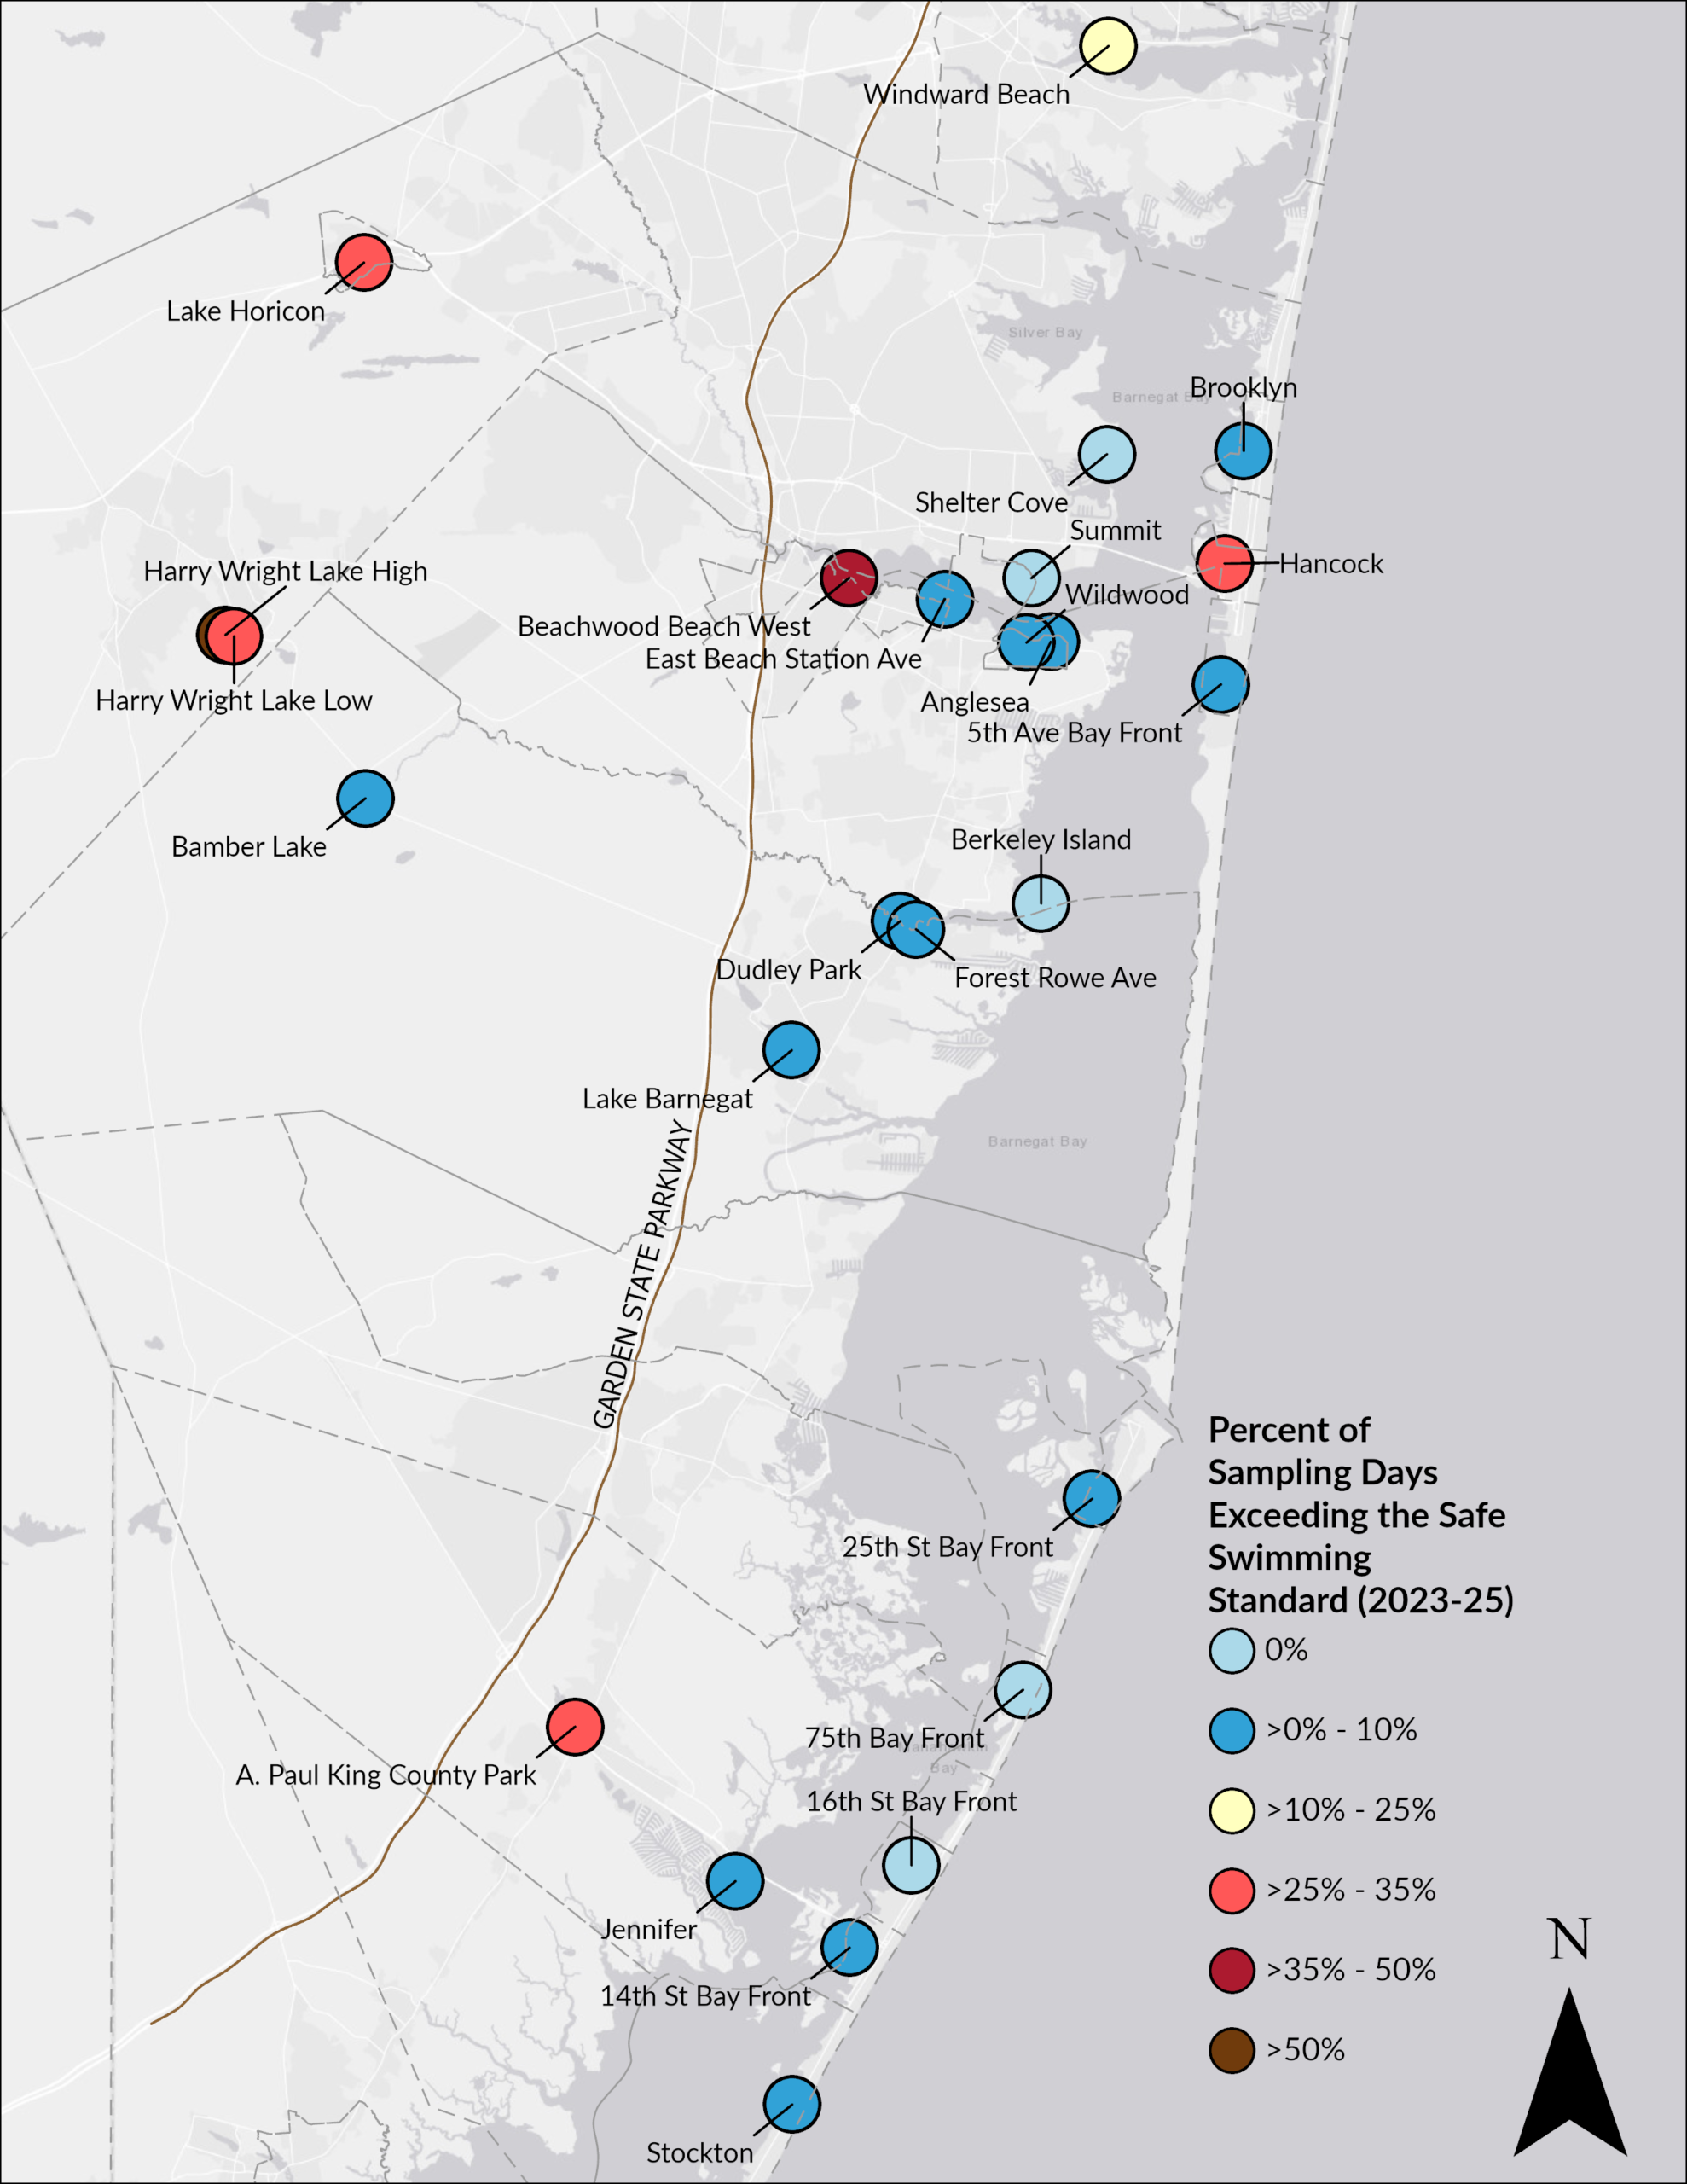
The percentage of sampling days that each beach exceeded safe swimming standards during the summer months between 2016 and 2018 established the baseline. This seasonal window was selected because the vast majority of recreational swimming occurs during this period. From 2023 through 2025, five of the 25 monitored locations (20%) exhibited higher exceedance rates than their baseline, indicating that water quality at those sites deteriorated over time; consequently, the ambitious target of zero declining beaches was not achieved. On a positive note, many monitored areas continue to maintain very low exceedance frequencies and remain routinely safe for swimming (Figure 1). However, a few problematic locations—such as Beachwood and Hancock—persistently lag behind and should be prioritized by their respective municipalities for targeted investigation and remediation.
To pinpoint and address bacterial contamination, municipalities and researchers can conduct pathogen trackdown studies. These investigations determine whether the pollution stems from human or animal origins, uncovering specific infrastructure failures like sewer line breaks or neglected maintenance. Once these problems are identified, targeted repairs and public education initiatives effectively lower bacteria levels. On an individual level, one of the most impactful ways residents can help protect local water quality is by properly disposing of pet waste, preventing stormwater runoff from carrying harmful bacteria directly into storm drains and local waterways.
TREND
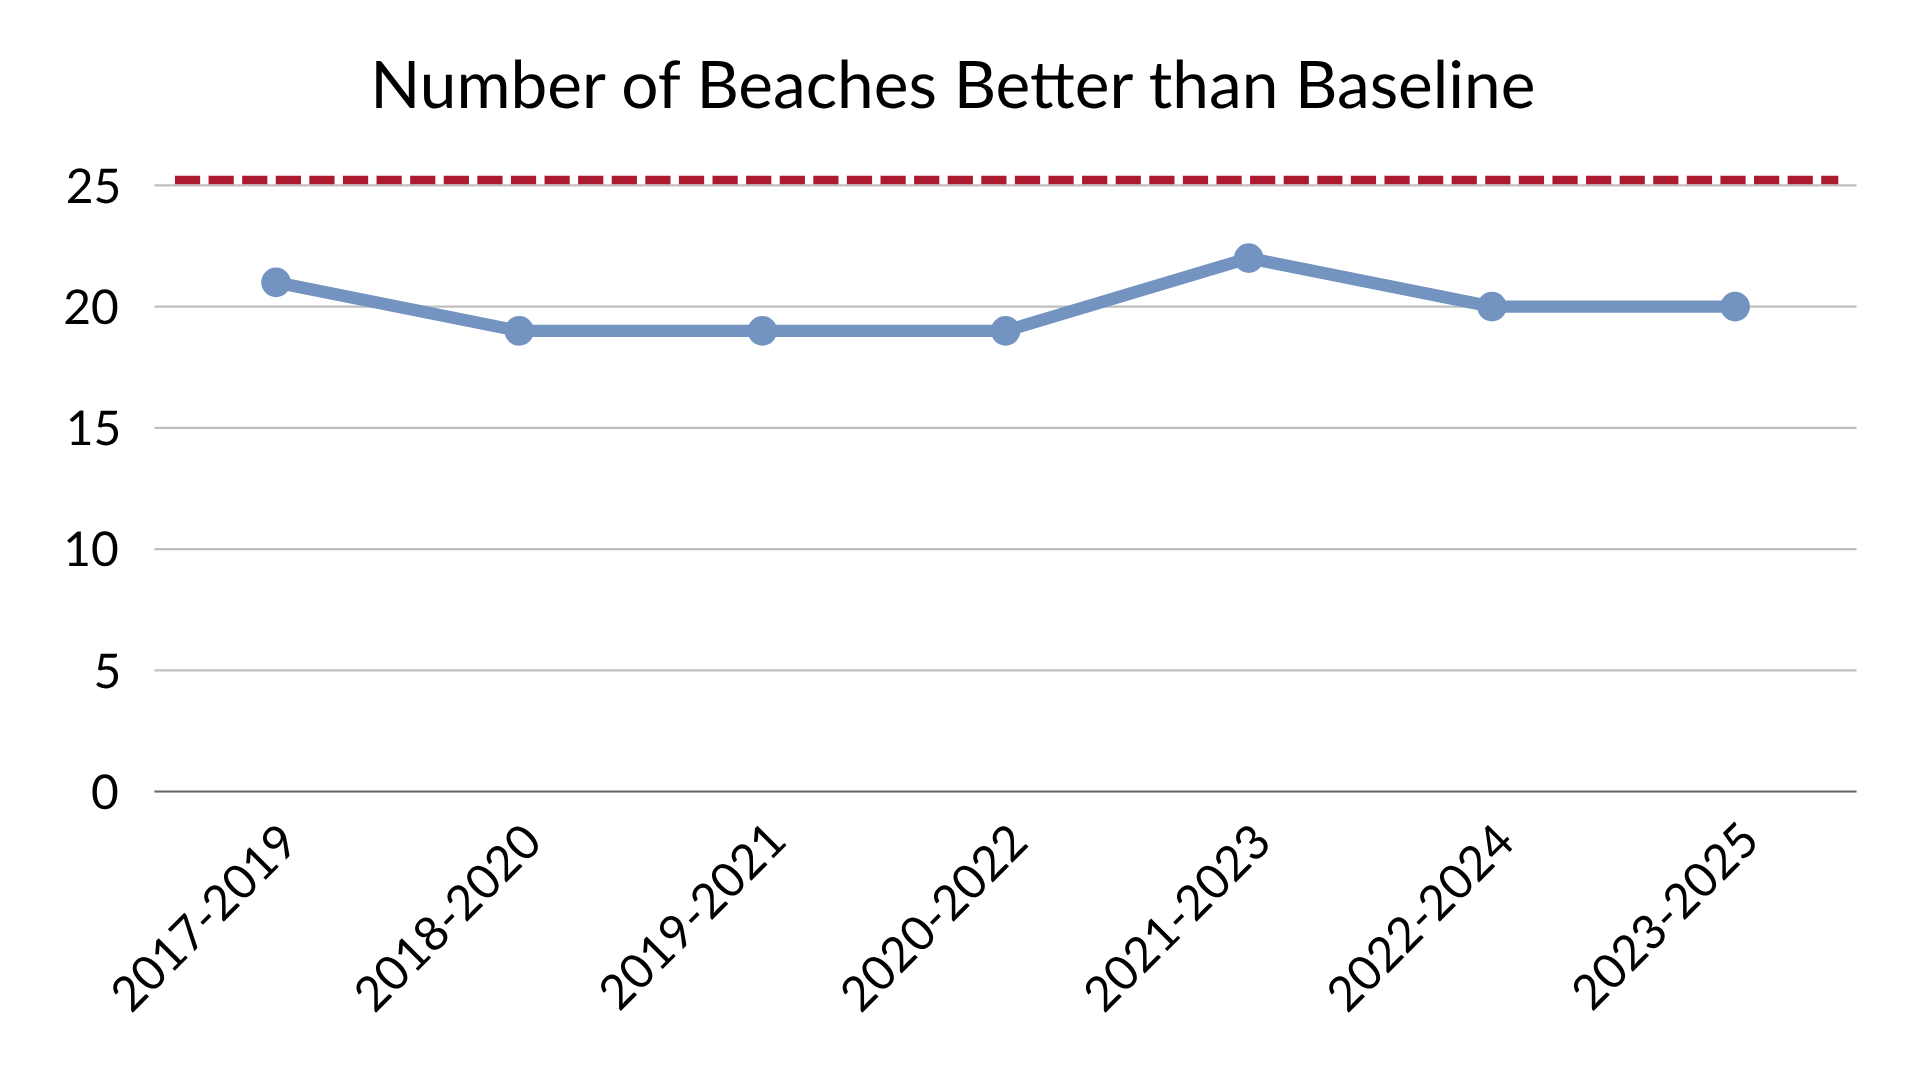
The number of beaches performing at or above their 2016–2018 baseline has remained relatively flat over time, indicating no statistically significant trend in the data (Figure 2). Currently, 20 beaches meet or exceed that baseline. For comparison, the 2017–2019 period immediately following the baseline window tracked 21 compliant beaches. This marginal difference underscores how little overall change has occurred across the monitored locations.
BACKGROUND
While most bacteria in the bay are harmless, certain species can cause illness or infection. These microorganisms enter the water from sources like animal and human waste, transported by stormwater runoff or leaking septic and sewer systems. To ensure safe swimming conditions, the Ocean County Health Department monitors two specific indicator bacteria: E. coli in freshwater and Enterococcus in saltwater or brackish areas. E. coli, a type of fecal coliform, can directly cause illness upon exposure. Conversely, Enterococcus is typically benign, but its presence signals that other harmful pathogens may be lurking in the water. Ultimately, how often a beach exceeds safe swimming standards reflects the frequency and volume of bacteria being flushed from the watershed into the waterways feeding the bay.
APPROVED SHELLFISH HARVEST AREAS
primary indicator: APPROVED SHELLFISH HARVEST AREAS
STATUS
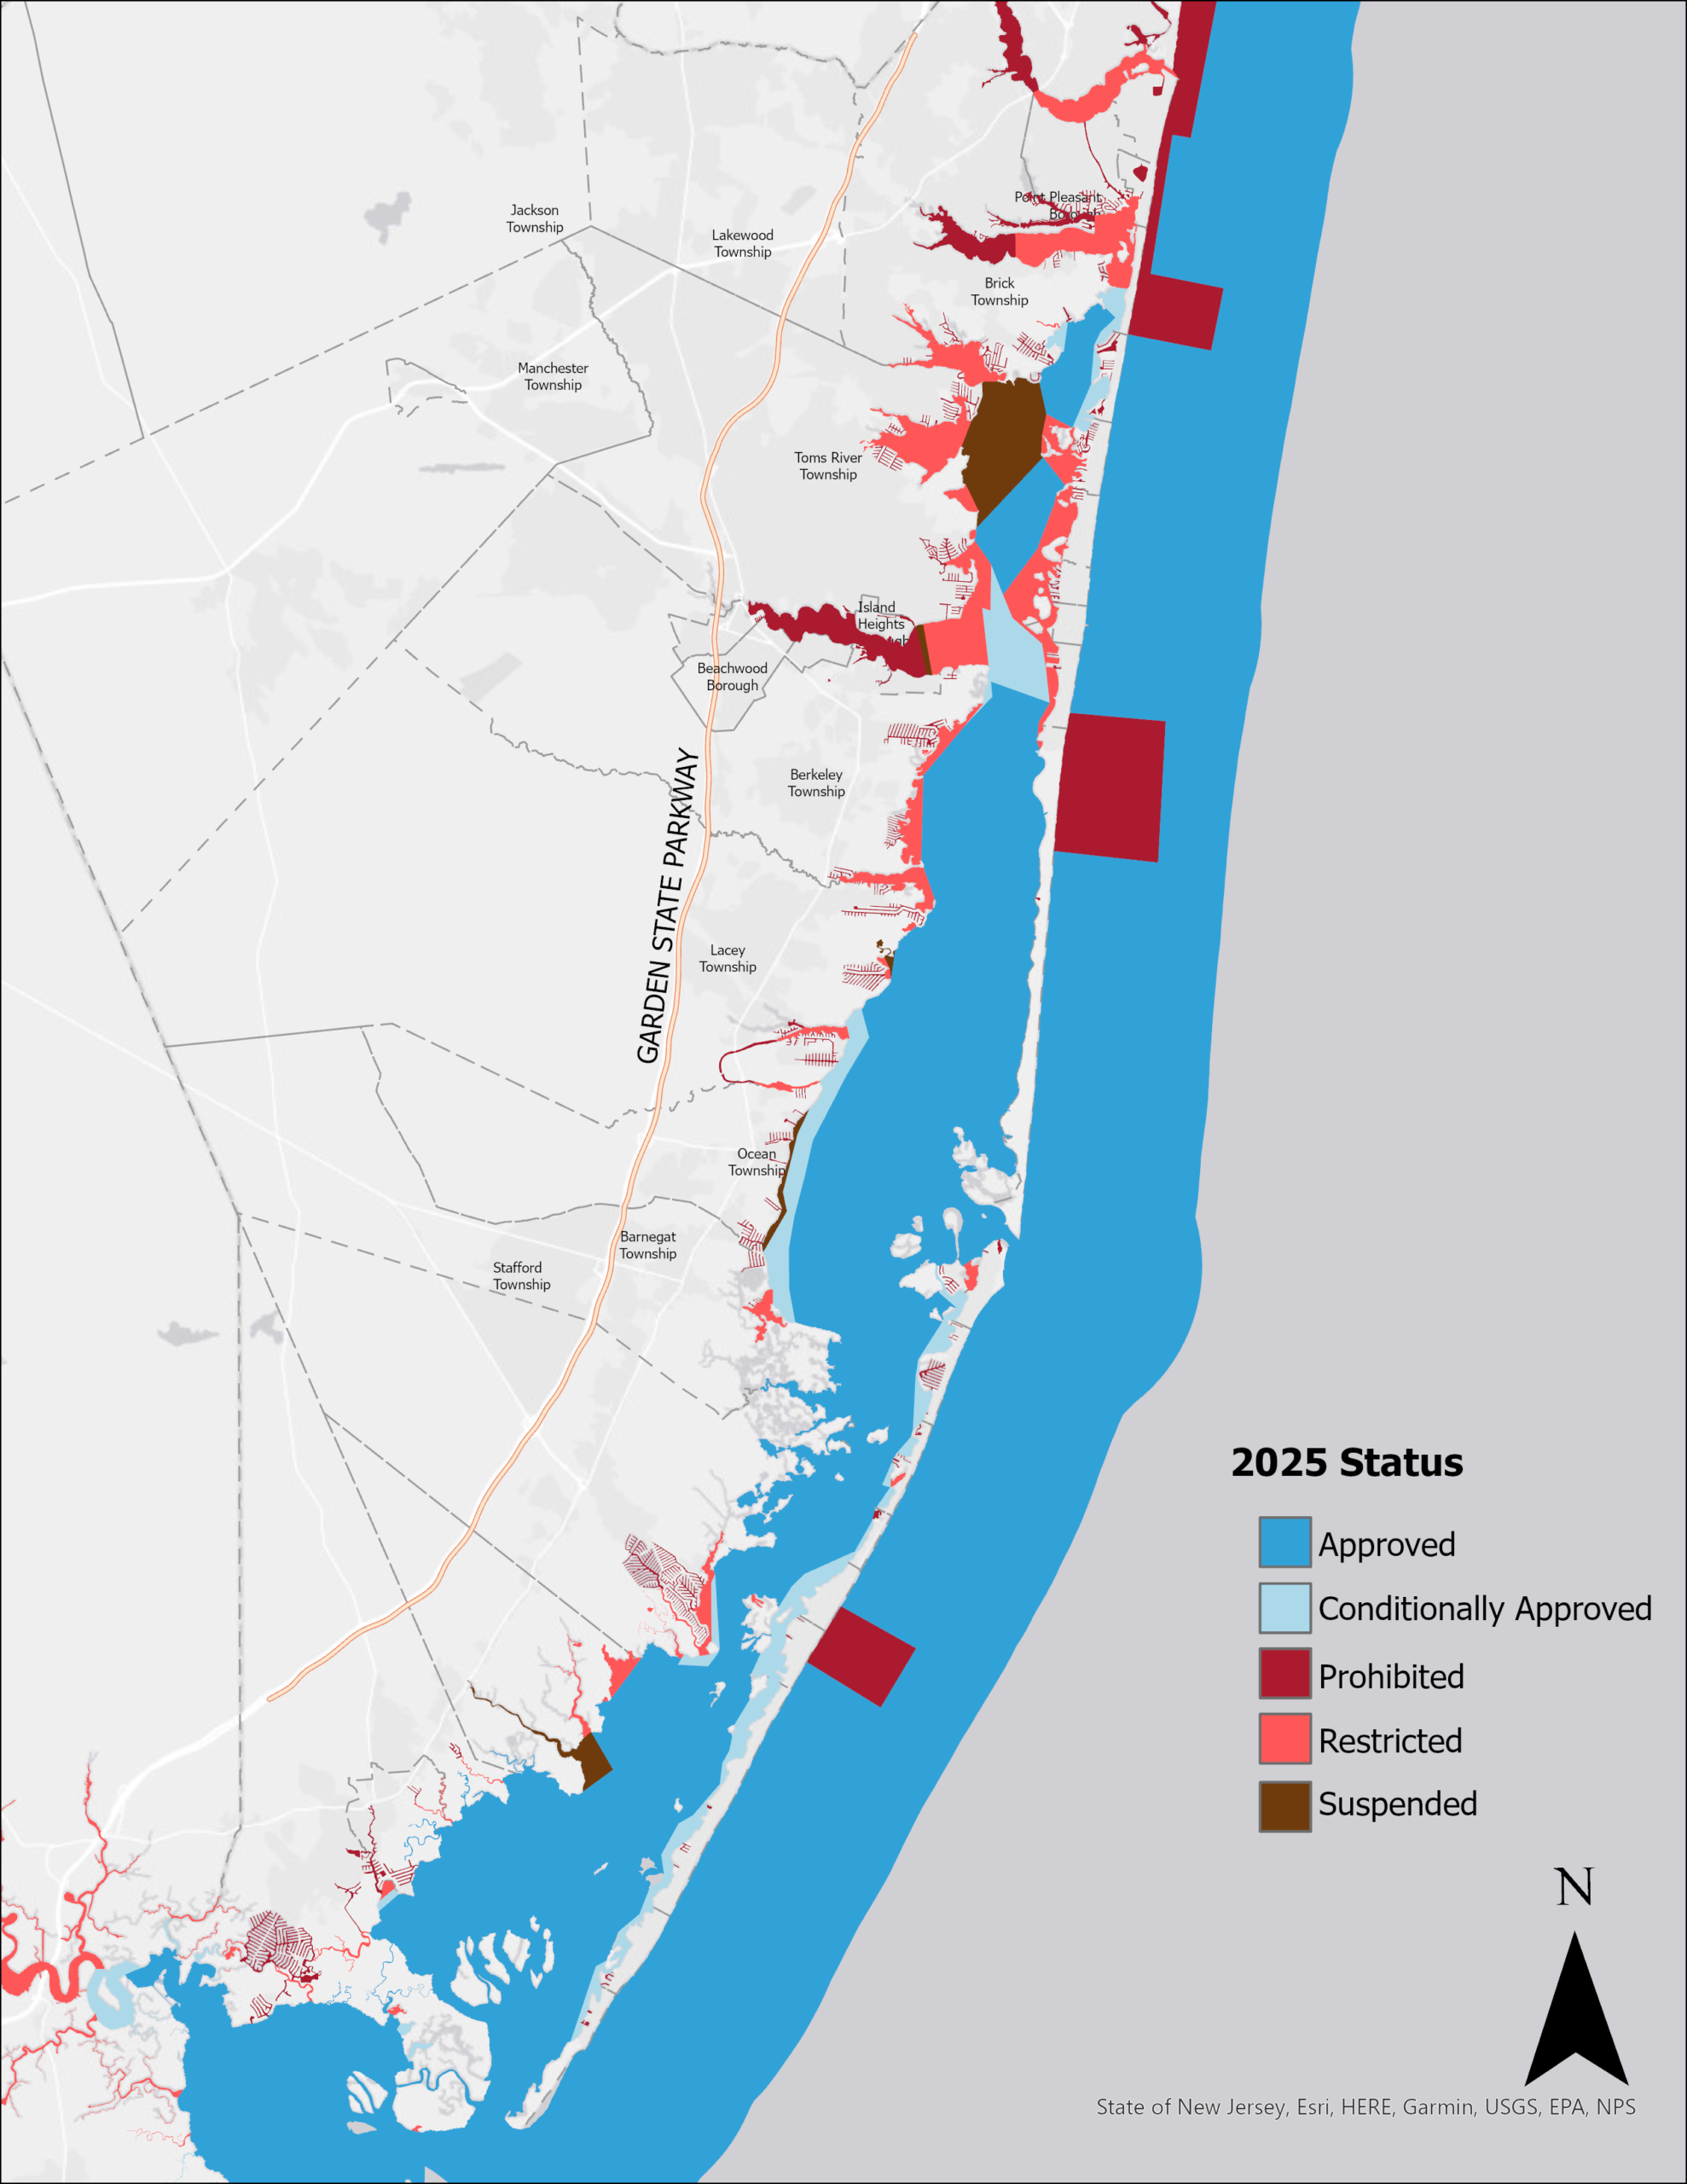
Currently, approximately 72.3% (50,545 acres) of Barnegat Bay waters are approved for shellfish harvesting. The remaining areas are classified as restricted (10.4%; 7,397 acres), conditionally approved (8.0%; 5,630 acres), prohibited (5.4%; 3,821 acres), and suspended (4.0%; 2,758 acres), as shown in Figures 3 and 4. These figures reflect a 1.3% decrease in approved acreage since 2020, driven primarily by a 1.9% expansion of suspended zones. While this downward shift is minor, it indicates that the target of expanding approved shellfish waters has not yet been achieved.
TREND
Poor water quality near shellfish beds is typically linked to stormwater runoff and other nonpoint sources rather than single, identifiable discharges. This pattern is most evident in the northern portion of the bay, where the majority of prohibited and restricted waters occur. The red prohibited zones shown offshore in Figure 3 represent administrative buffers around wastewater outfalls or other potential bacterial vectors, rather than actual, measured degradation.
Over the past 14 years, the total acreage classified as restricted or prohibited has remained largely unchanged. However, approved harvesting waters have decreased slightly—marking a loss of 1,708 acres since 2011—while suspended classifications have expanded by 2,758 acres over that same timeframe (see Figure 4).
CCMP Priorities: Water Quality, Living Resources
TARGET
Upgrade 5% of the potentially harvestable shellfish acreage that is currently restricted or closed for shellfishing compared to the 2020 acreage (11,267 acres).
PROGRESS MADE
- Most shellfish beds remain open for shellfish harvest.
INVESTMENT NEEDS
- Studies are needed to locate and address sources of bacteria.
BACKGROUND
As filter feeders, bivalves like clams and oysters ingest waterborne pollutants, including bacteria, from their surroundings. Common vectors for these unwanted bacteria include wildlife, domestic animal waste, and human sewage leaking from compromised septic or sewer systems. Because shellfish are frequently consumed raw, they carry a higher risk of causing foodborne illness than other seafood.
To protect public health, the NJDEP’s Bureau of Marine Water Monitoring tracks fecal coliform levels—an indicator of fecal contamination—throughout the bay.
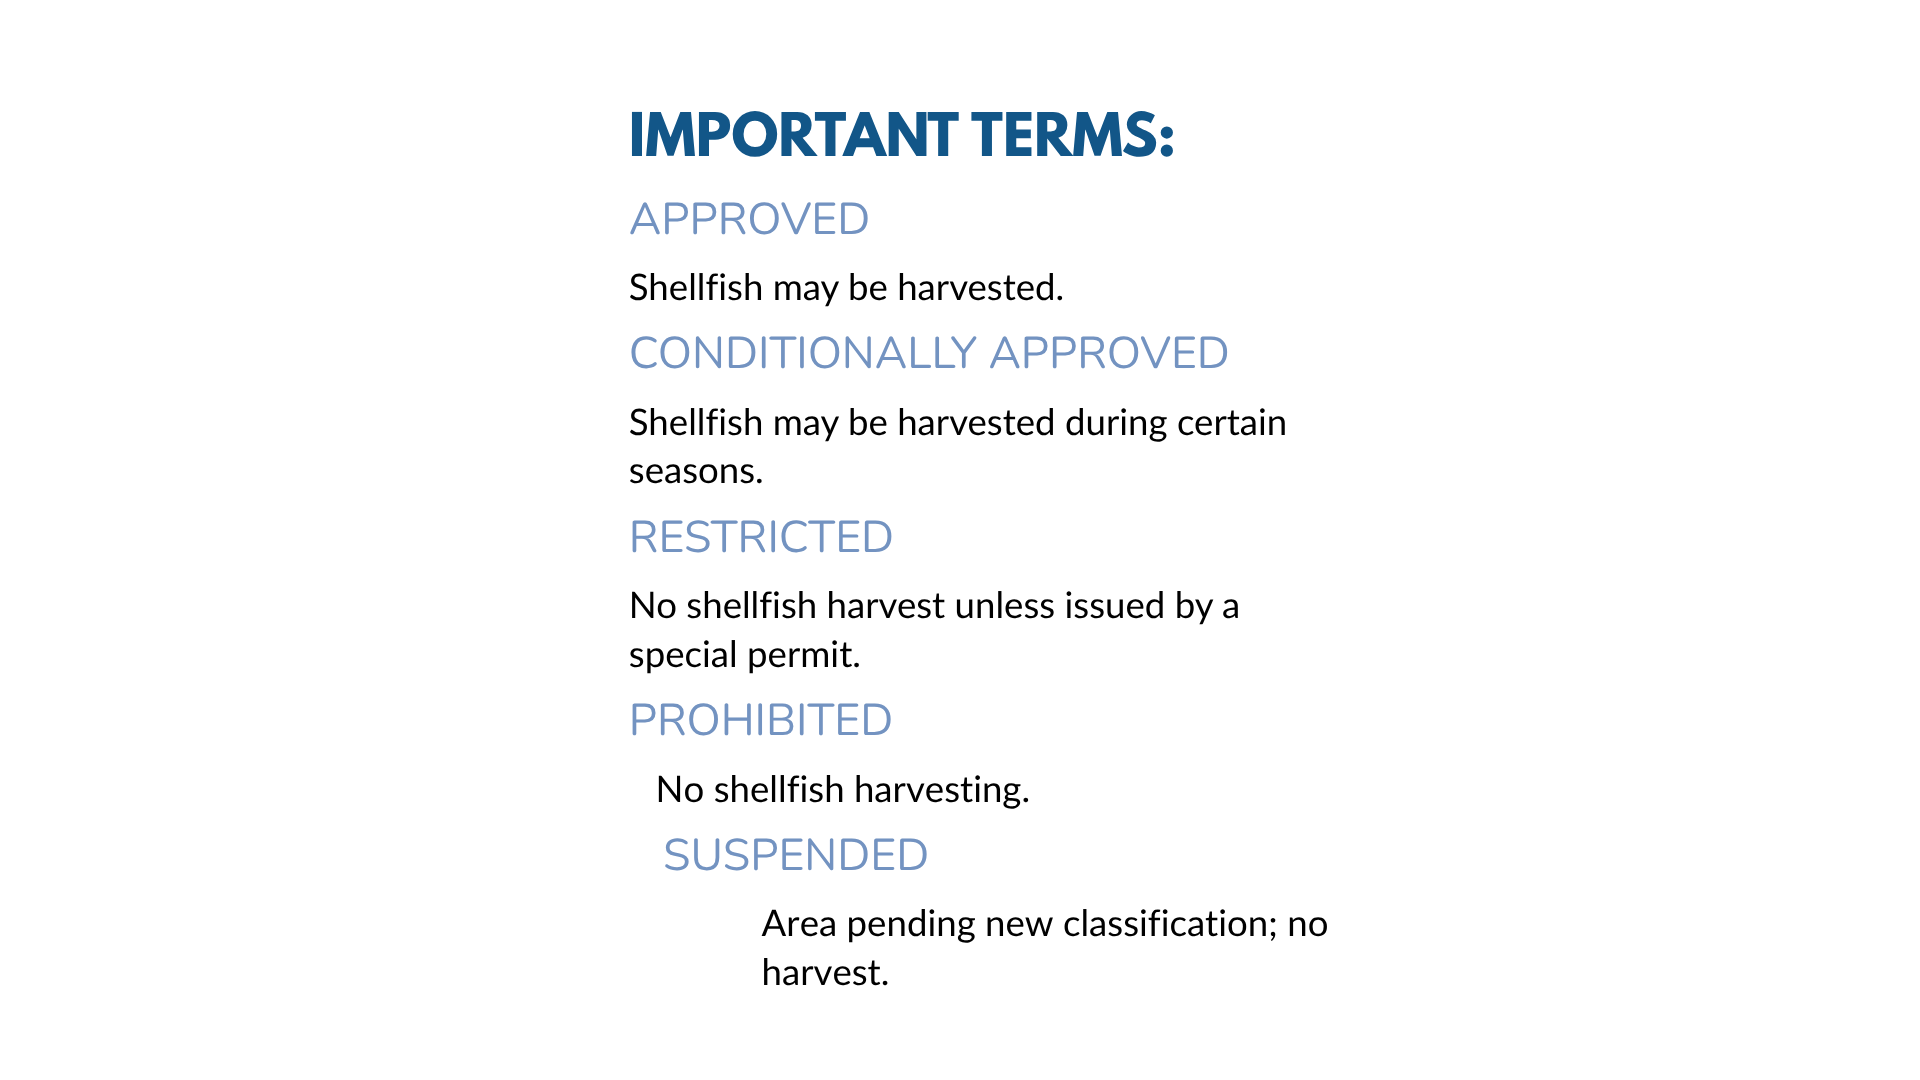
Based on these monitoring results and proximity to potential pollution vectors, harvesting waters are classified into five categories: approved, conditionally approved, restricted, prohibited, or suspended. State officials review these designations annually, analyzing the 30 most recent data points collected at each monitoring station over a multi-year period.
2011
2015
2020
2025
SUBMERGED AQUATIC VEGETATION
CCMP Priorities: Water Quality, Living Resources, Water Supply, Land Use
TARGET
Maintain the overall extent of submerged aquatic vegetation (SAV) present in 2009 (12,980 acres) and restore an additional 10 acres of seagrass.
PROGRESS MADE
- New SAV maps have been created and are being refined.
- Funding has been committed to priority research and restoration efforts.
INVESTMENT NEEDS
- Regular Bay-wide mapping informs long-term SAV management.
- Infrastructure (e.g., seed processing facilities) is vital to SAV restoration.
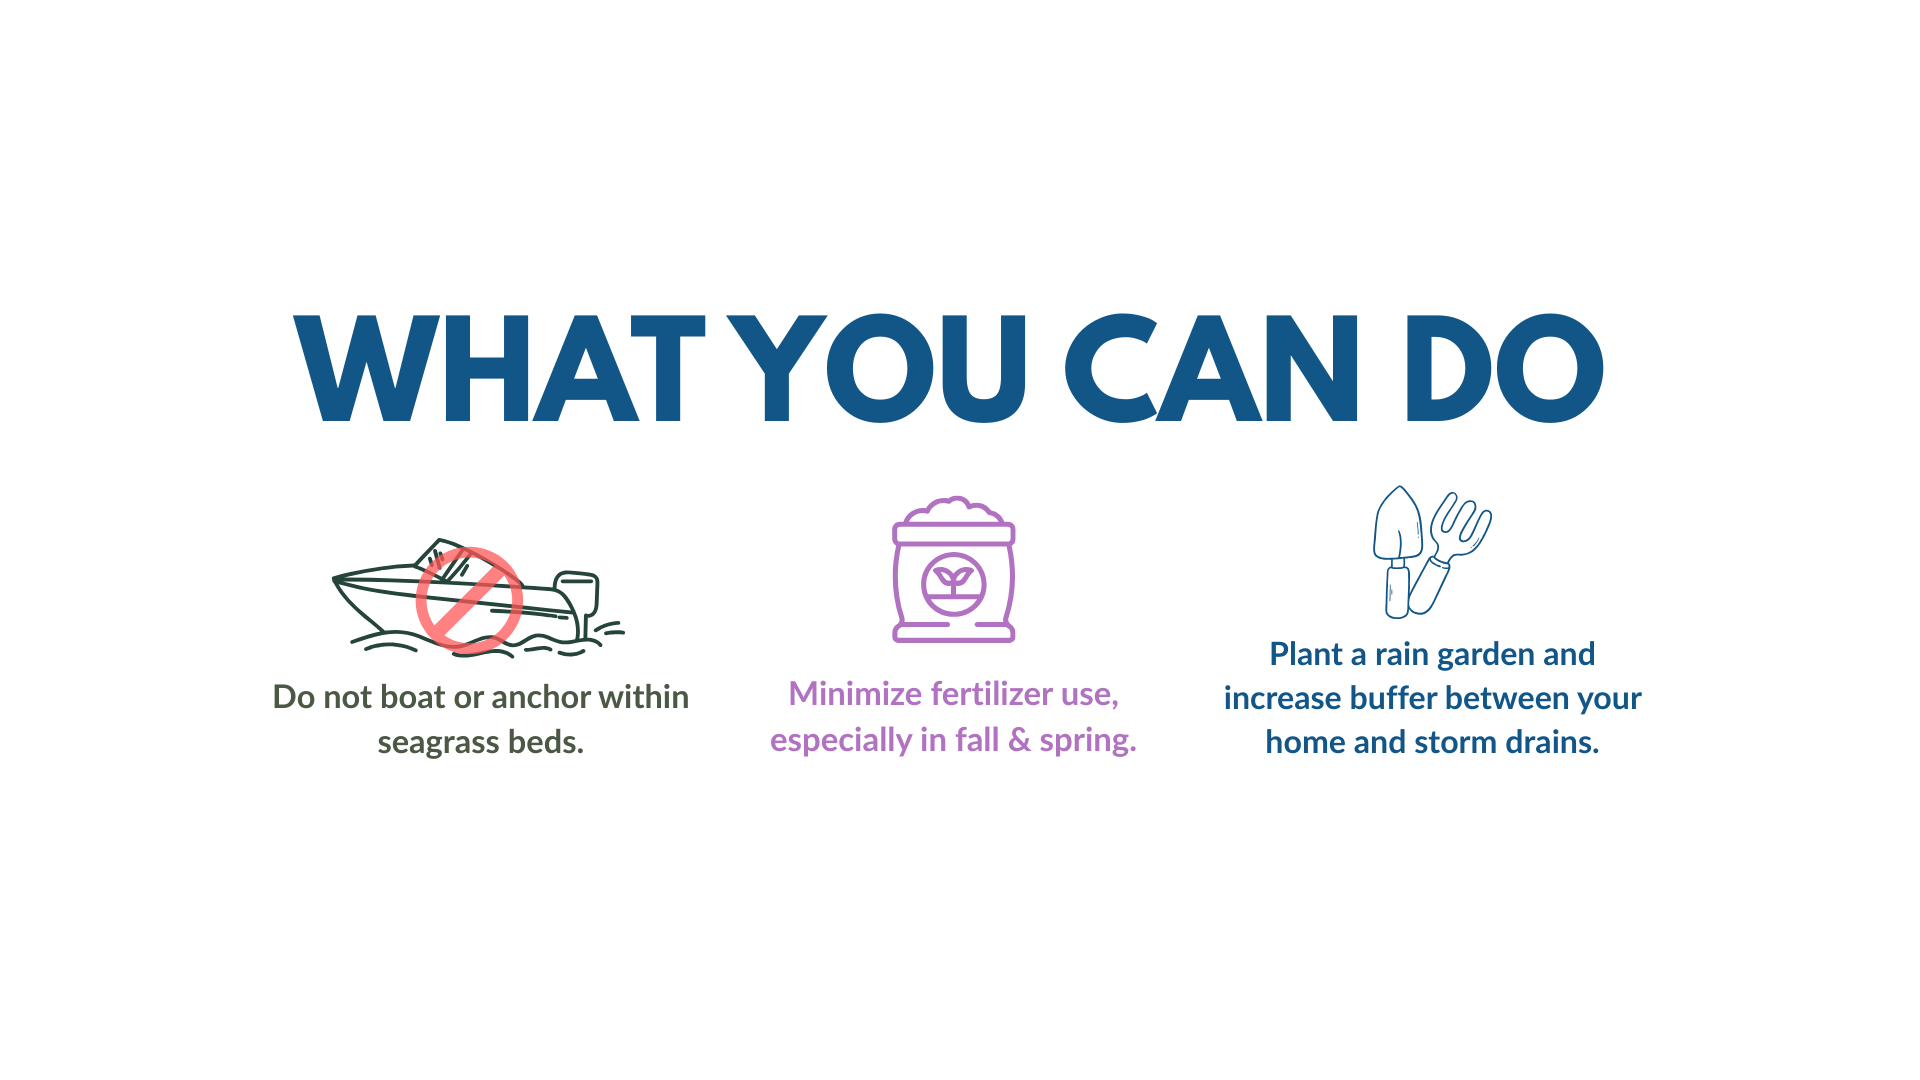
- Reductions in nutrient and sediment loading is needed to protect existing beds.
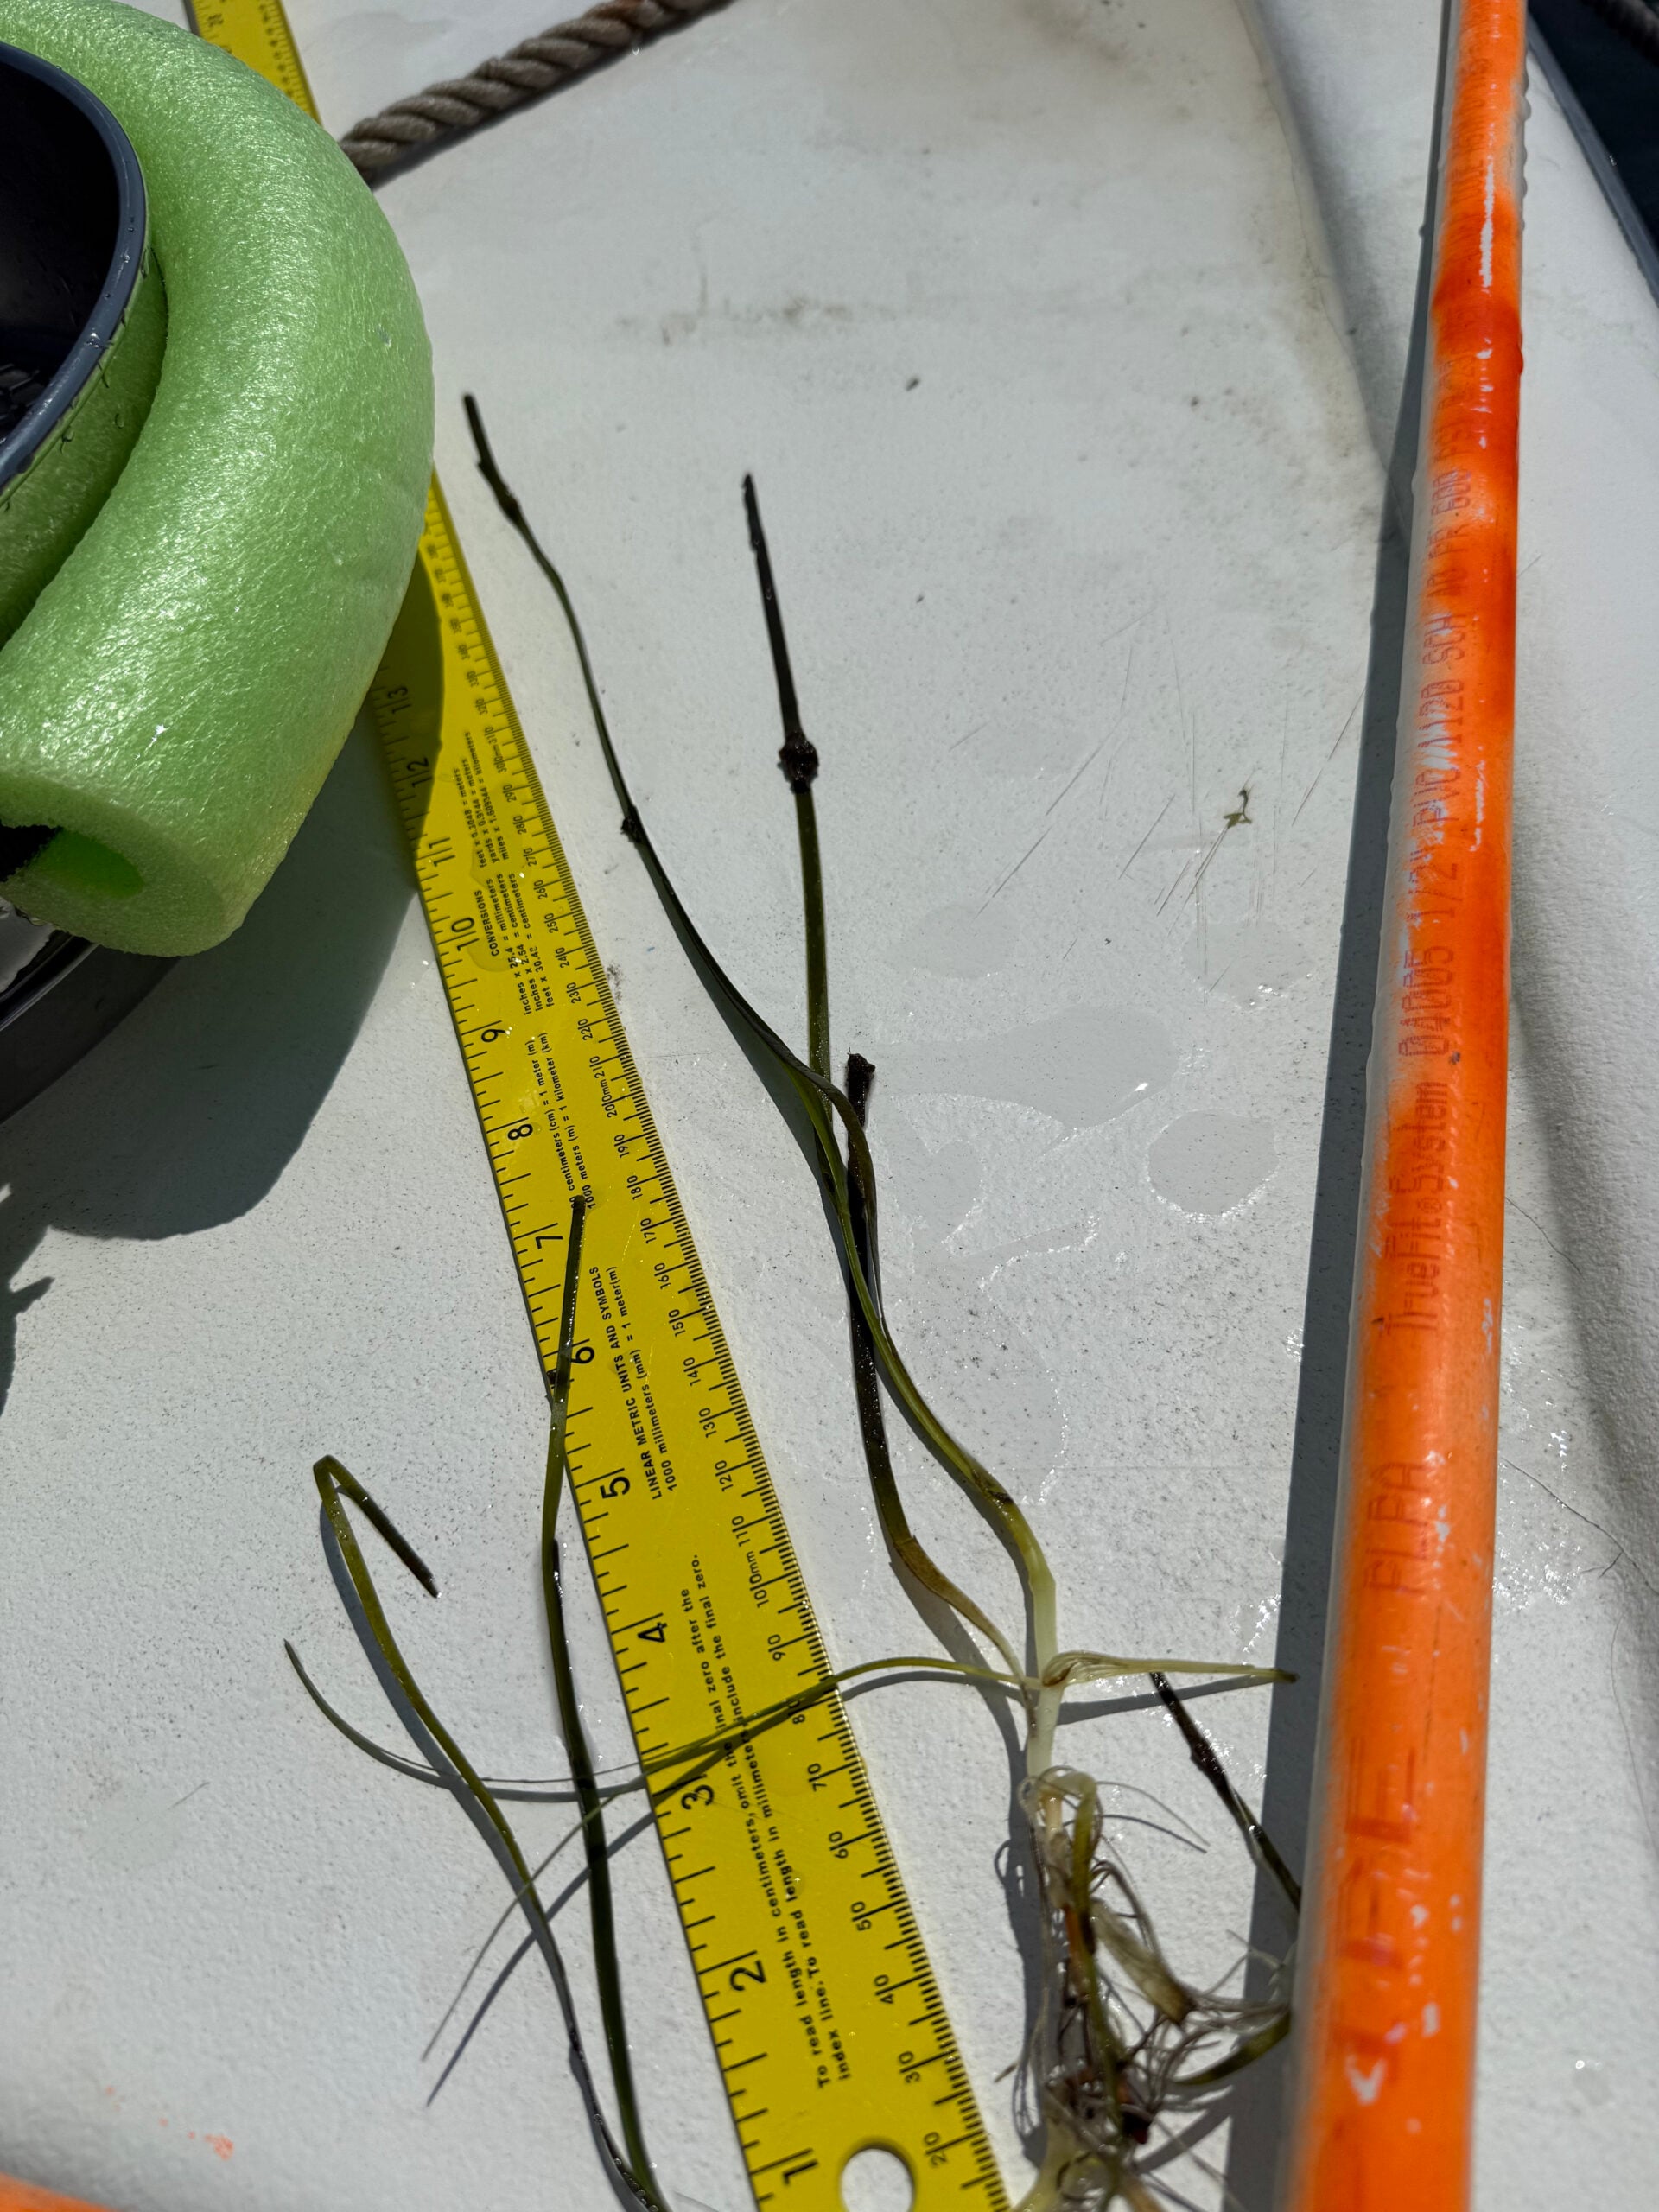
BACKGROUND
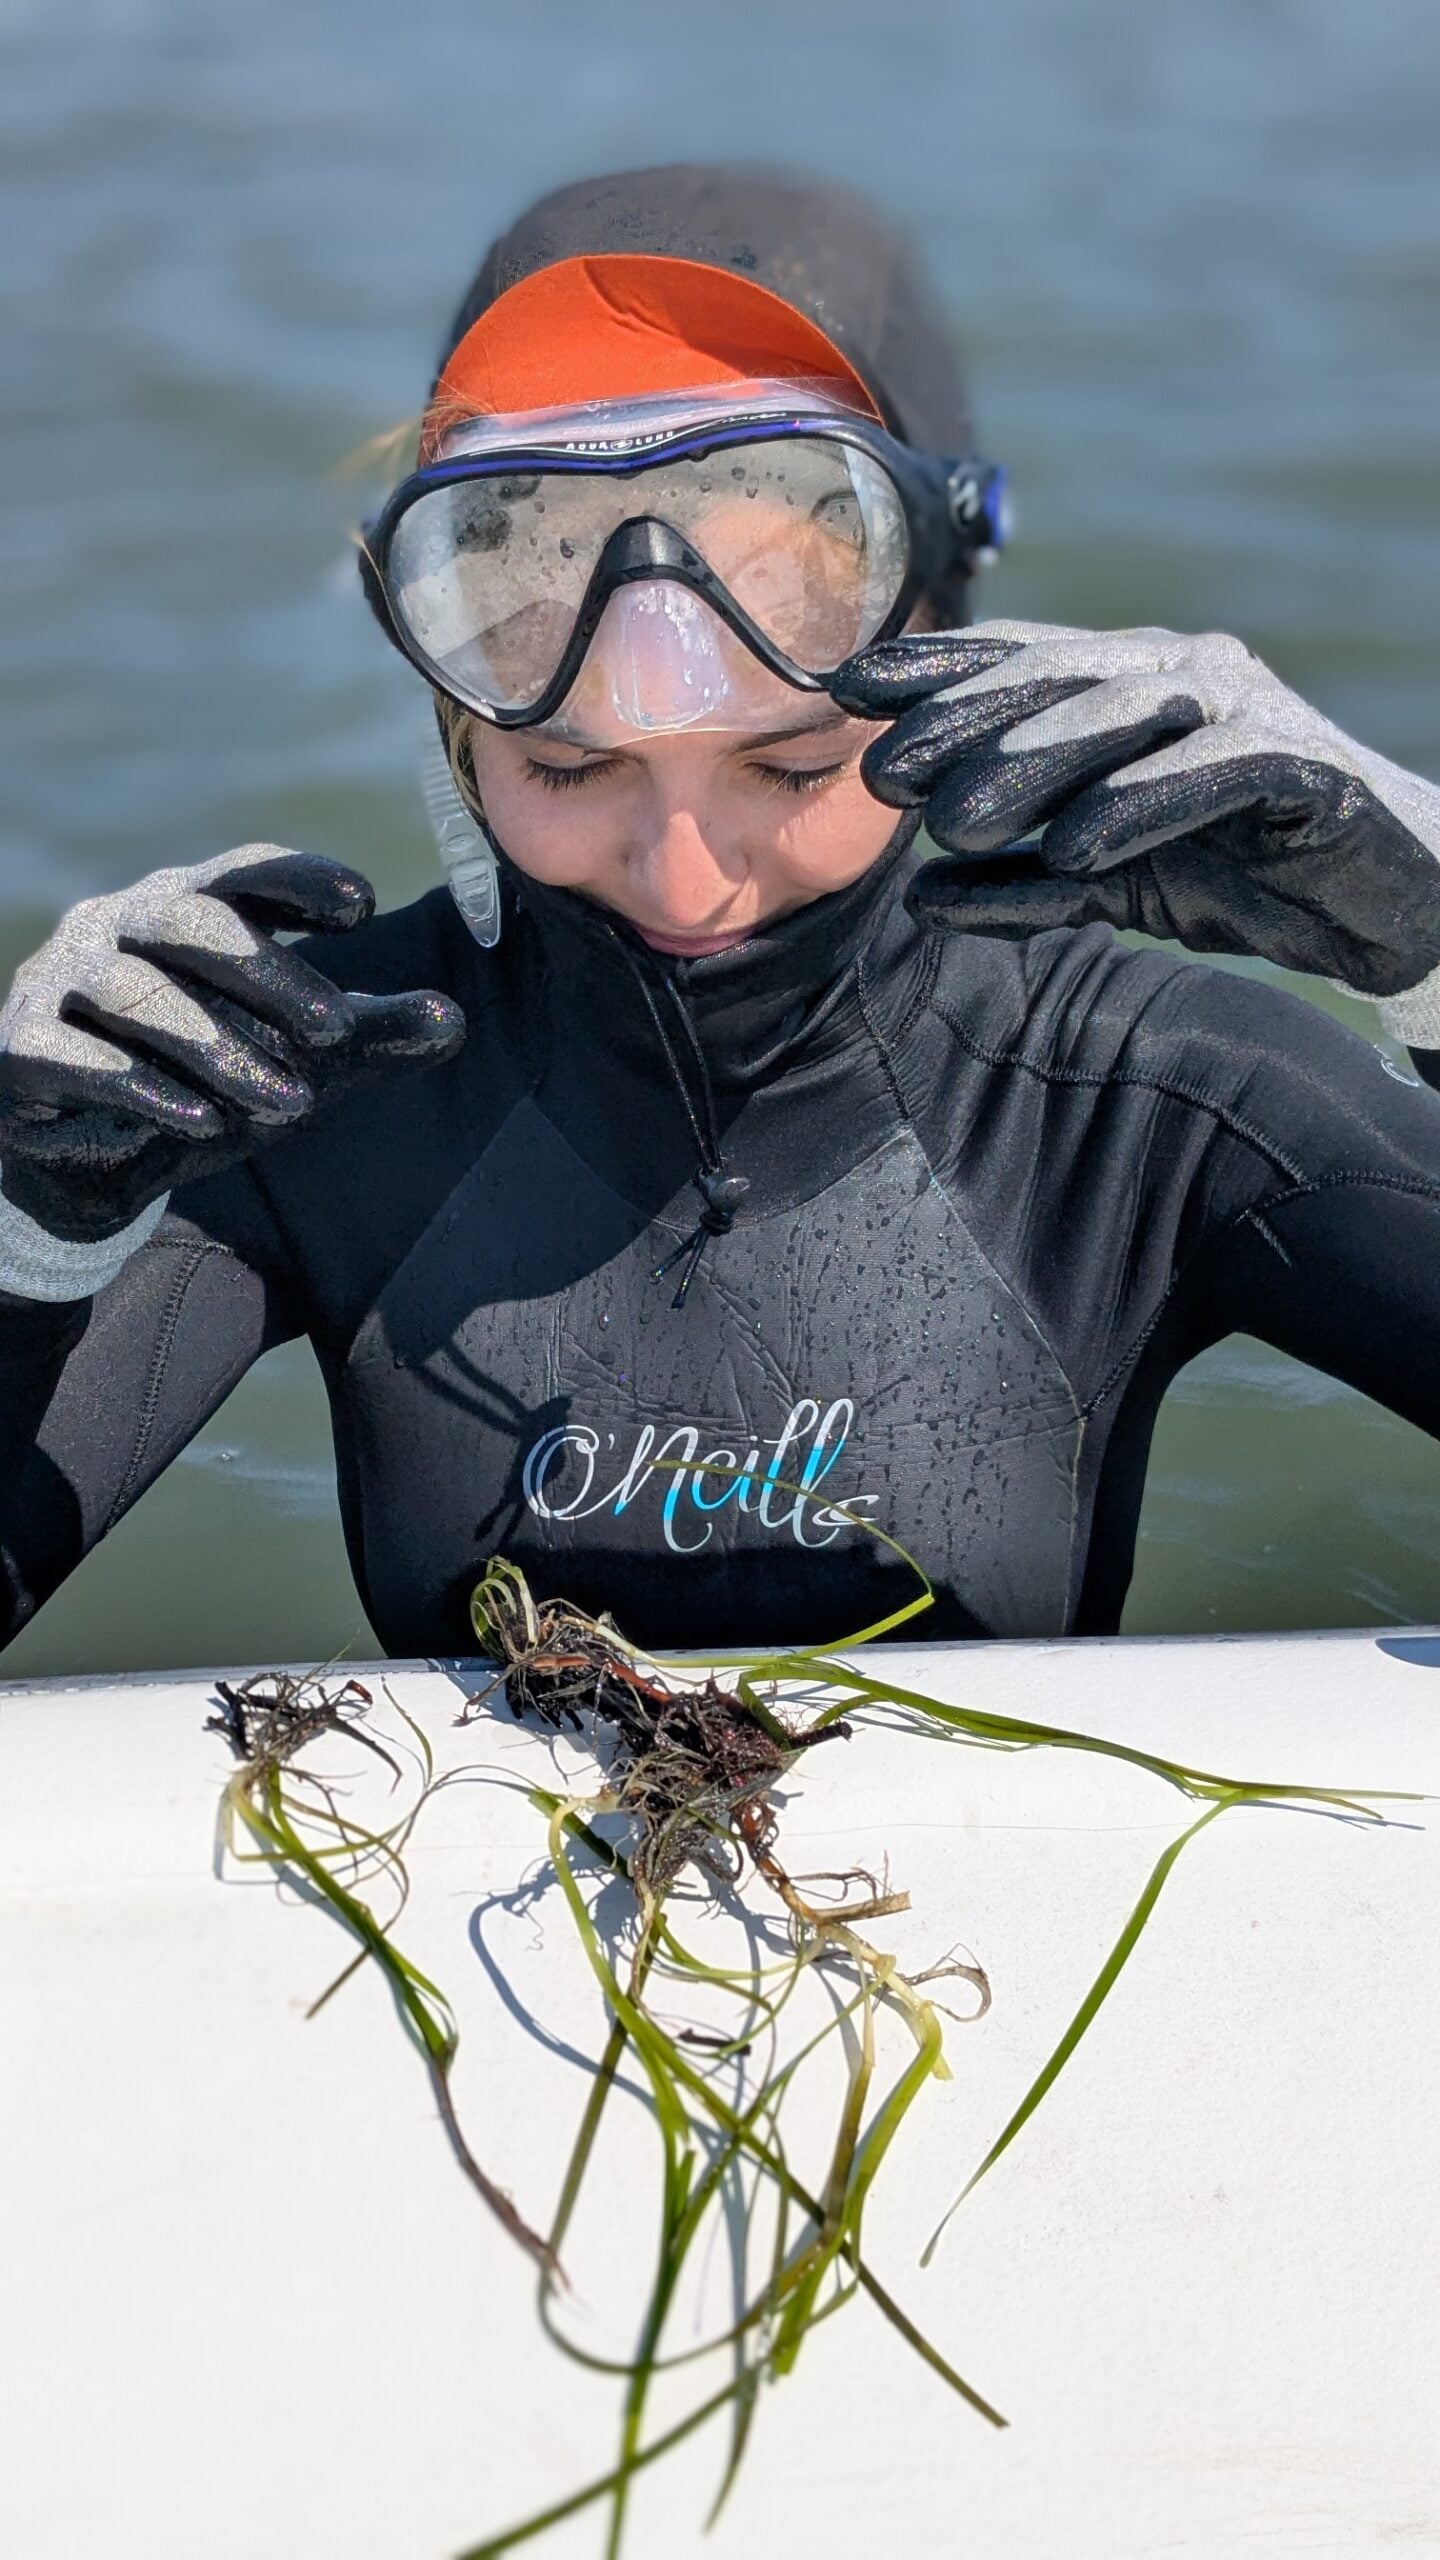
Seagrass beds provide essential habitat for many key estuarine species, including bay scallops, blue crabs, and summer flounder. These underwater meadows improve water quality by trapping pollutants, stabilizing benthic sediments, and dampening wave energy. Because these plants require exceptional water clarity and react sharply to excess nutrients, they serve as invaluable indicators of the bay’s overall ecological condition.
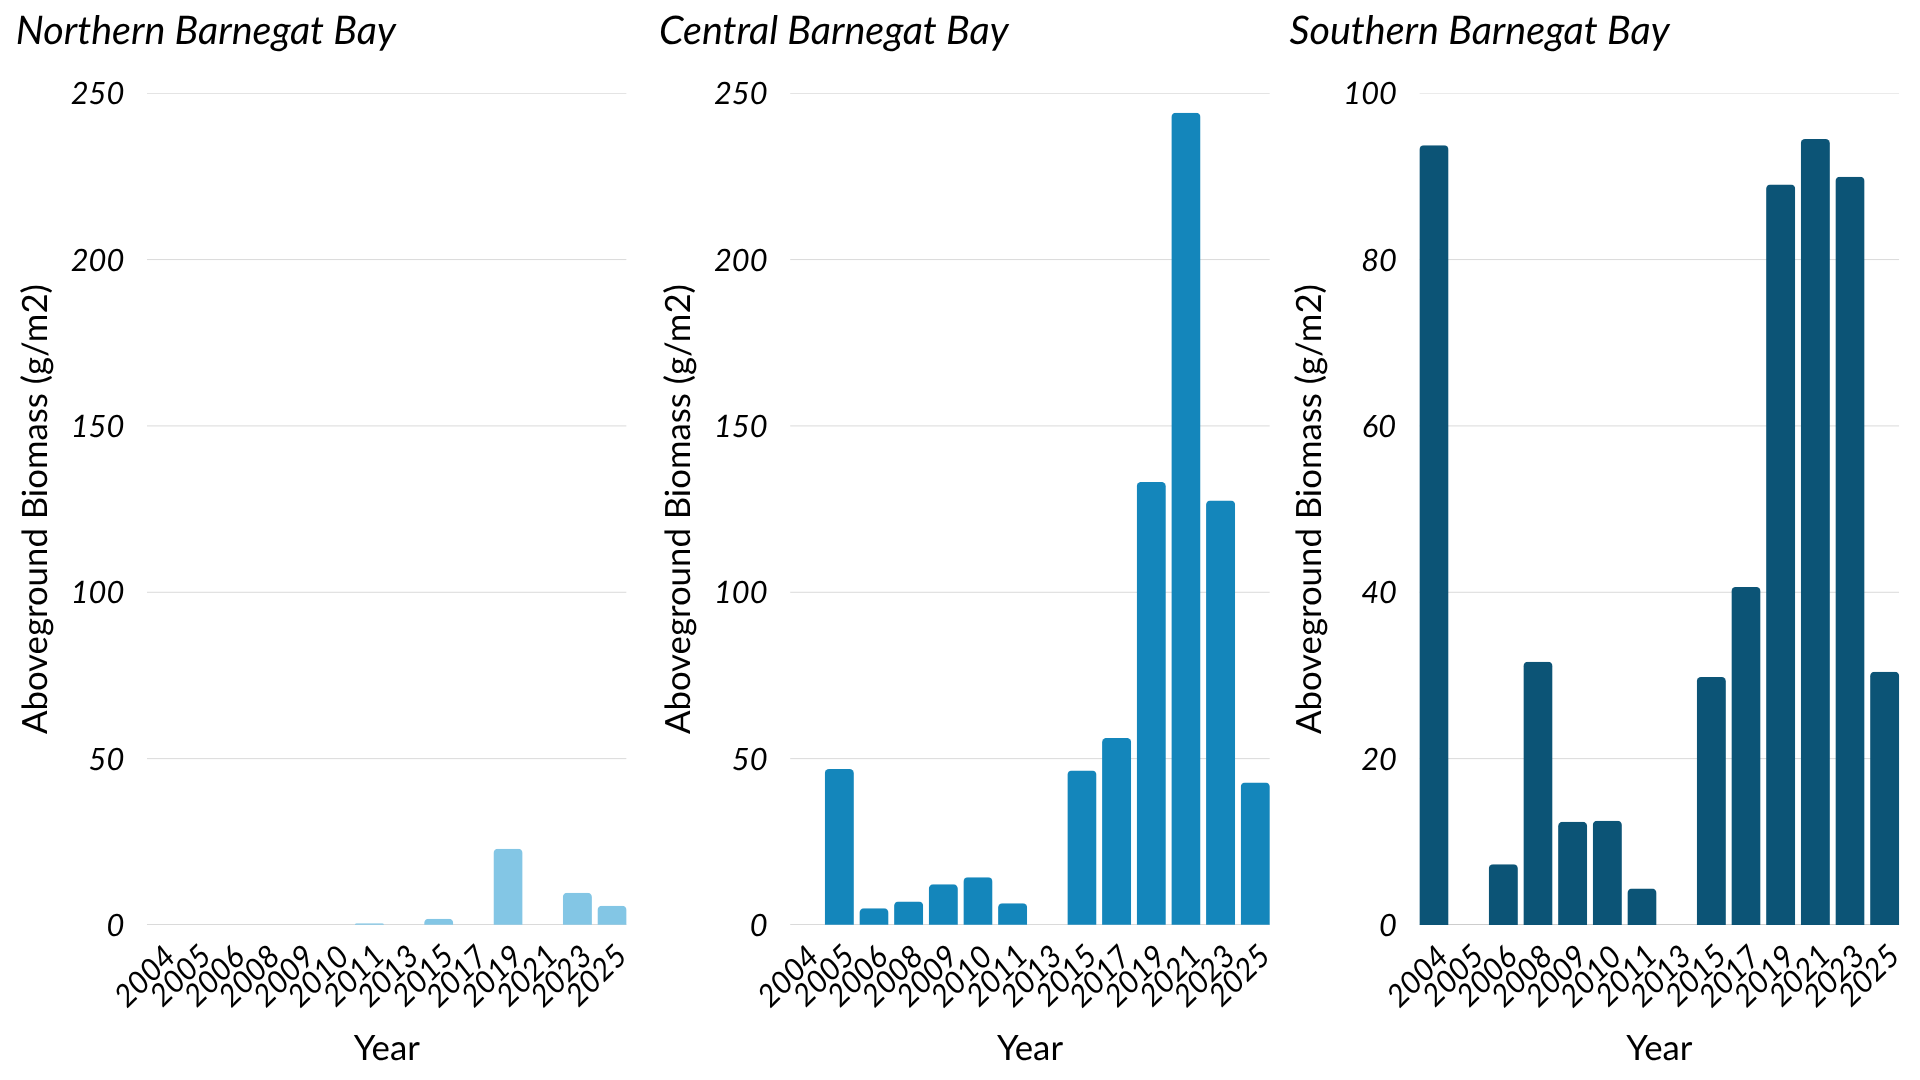
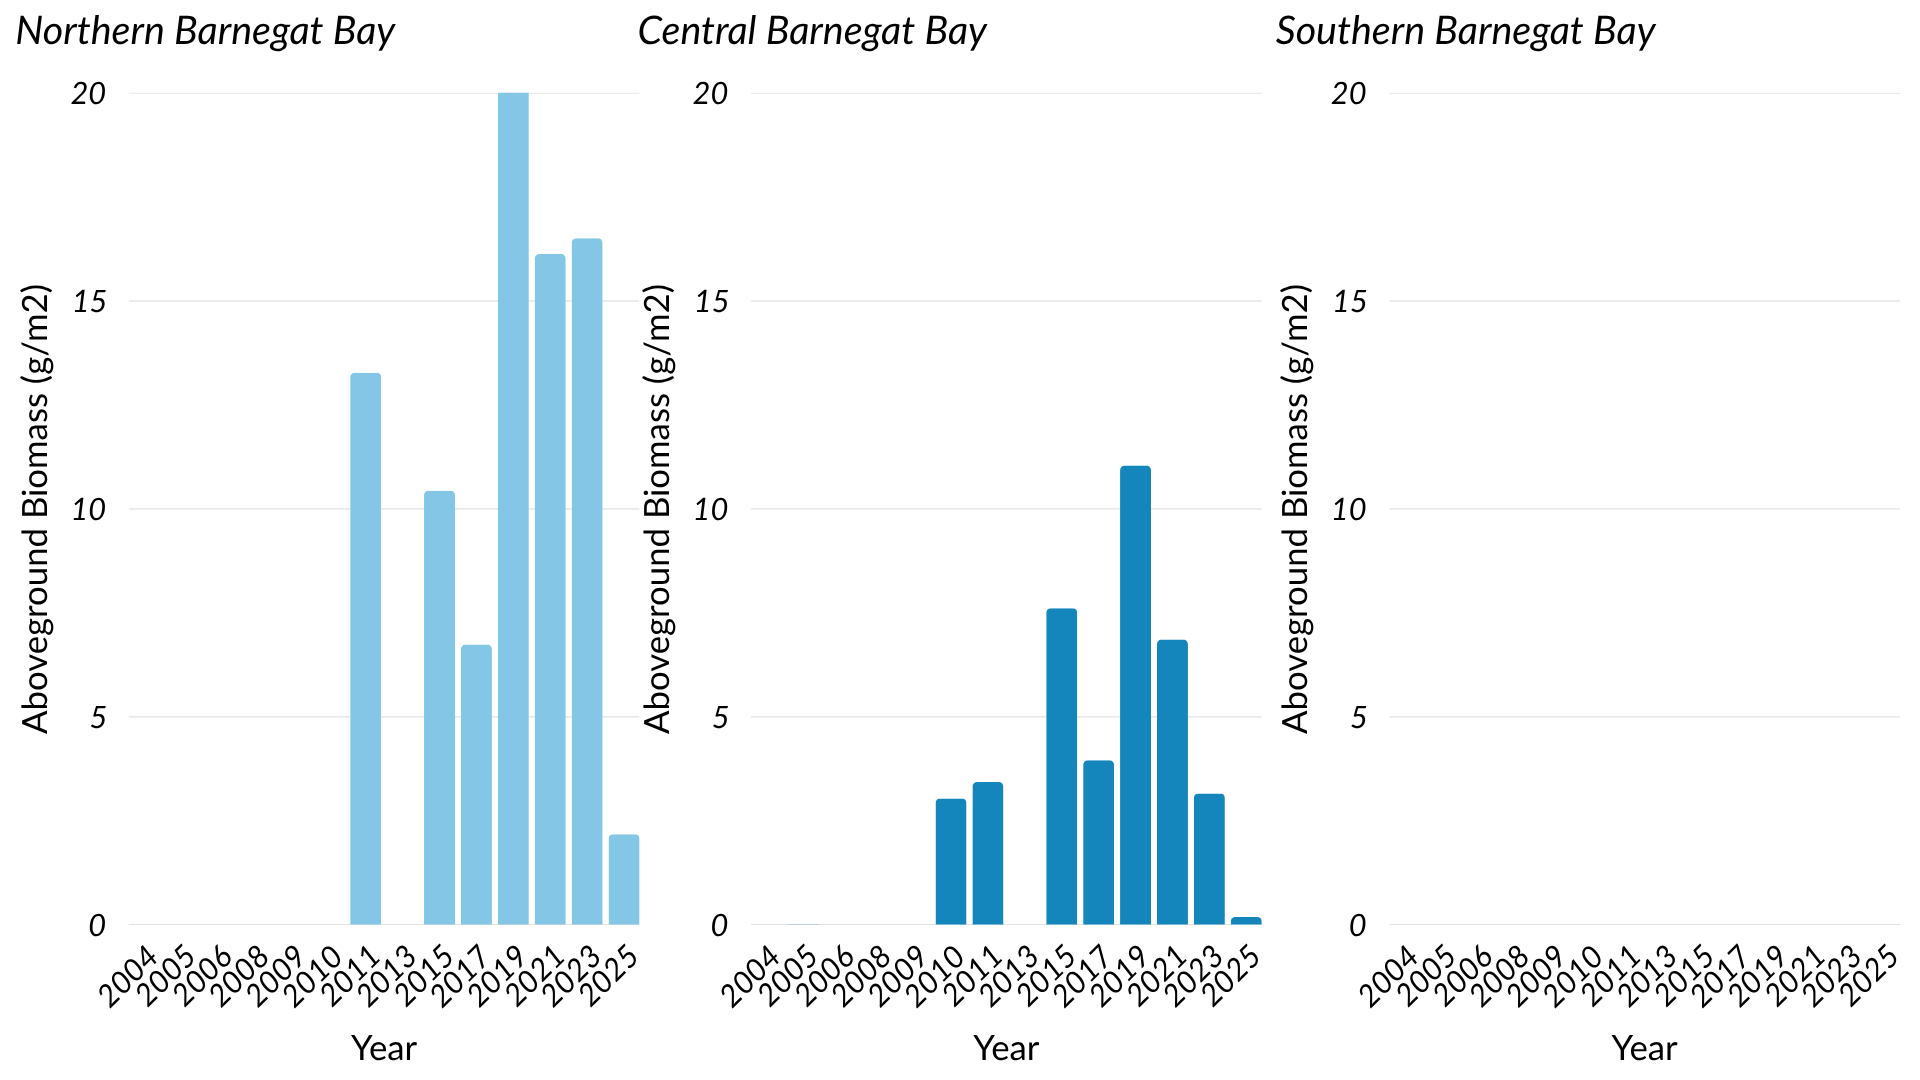
Monitoring these habitats over time allows scientists to track shifting water quality trends. Beyond nutrient loading, these sensitive ecosystems face physical threats from boat propellers, clam rakes, and severe storms that can uproot them or bury them in sediment. Within Barnegat Bay, eelgrass (Zostera marina) dominates the southern waters below Toms River, whereas mixed beds of eelgrass and widgeon grass (Ruppia maritima) are more prevalent throughout the northern and central segments.
Total Zostera Biomass Above Ground
Total Ruppia Biomass Above Ground
primary indicator: Extent of Submerged Aquatic Vegetation
STATUS
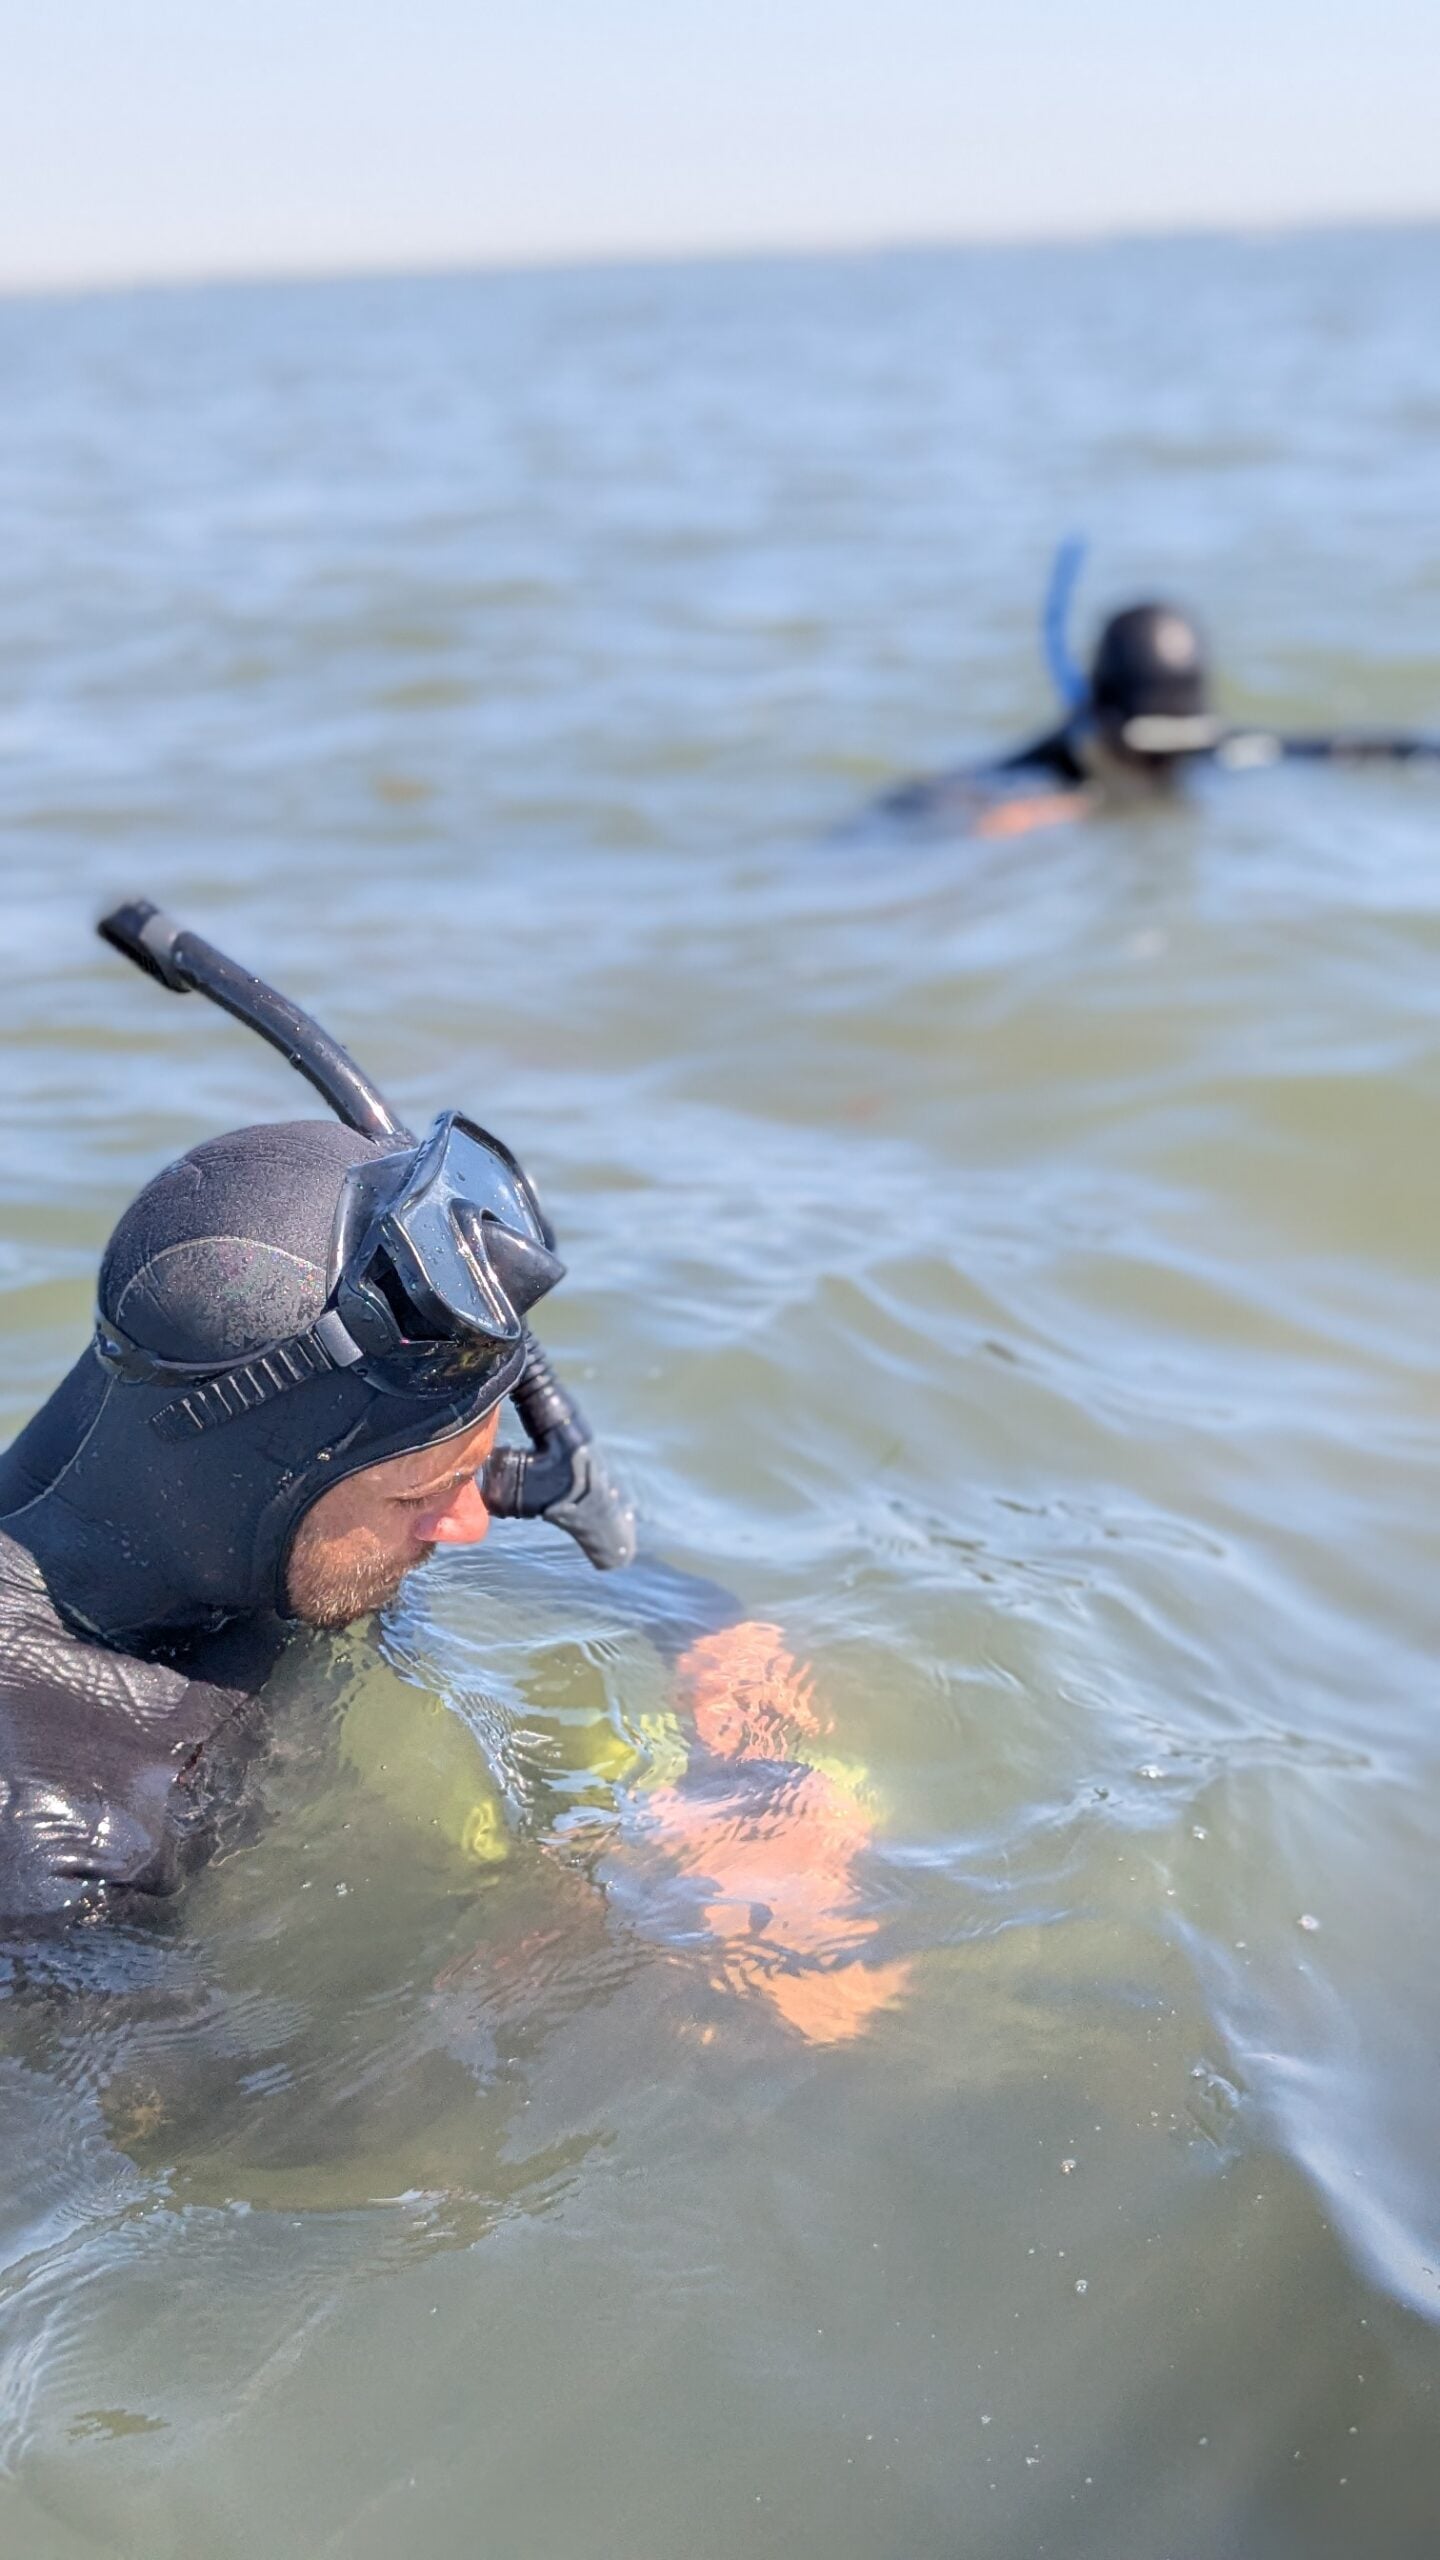
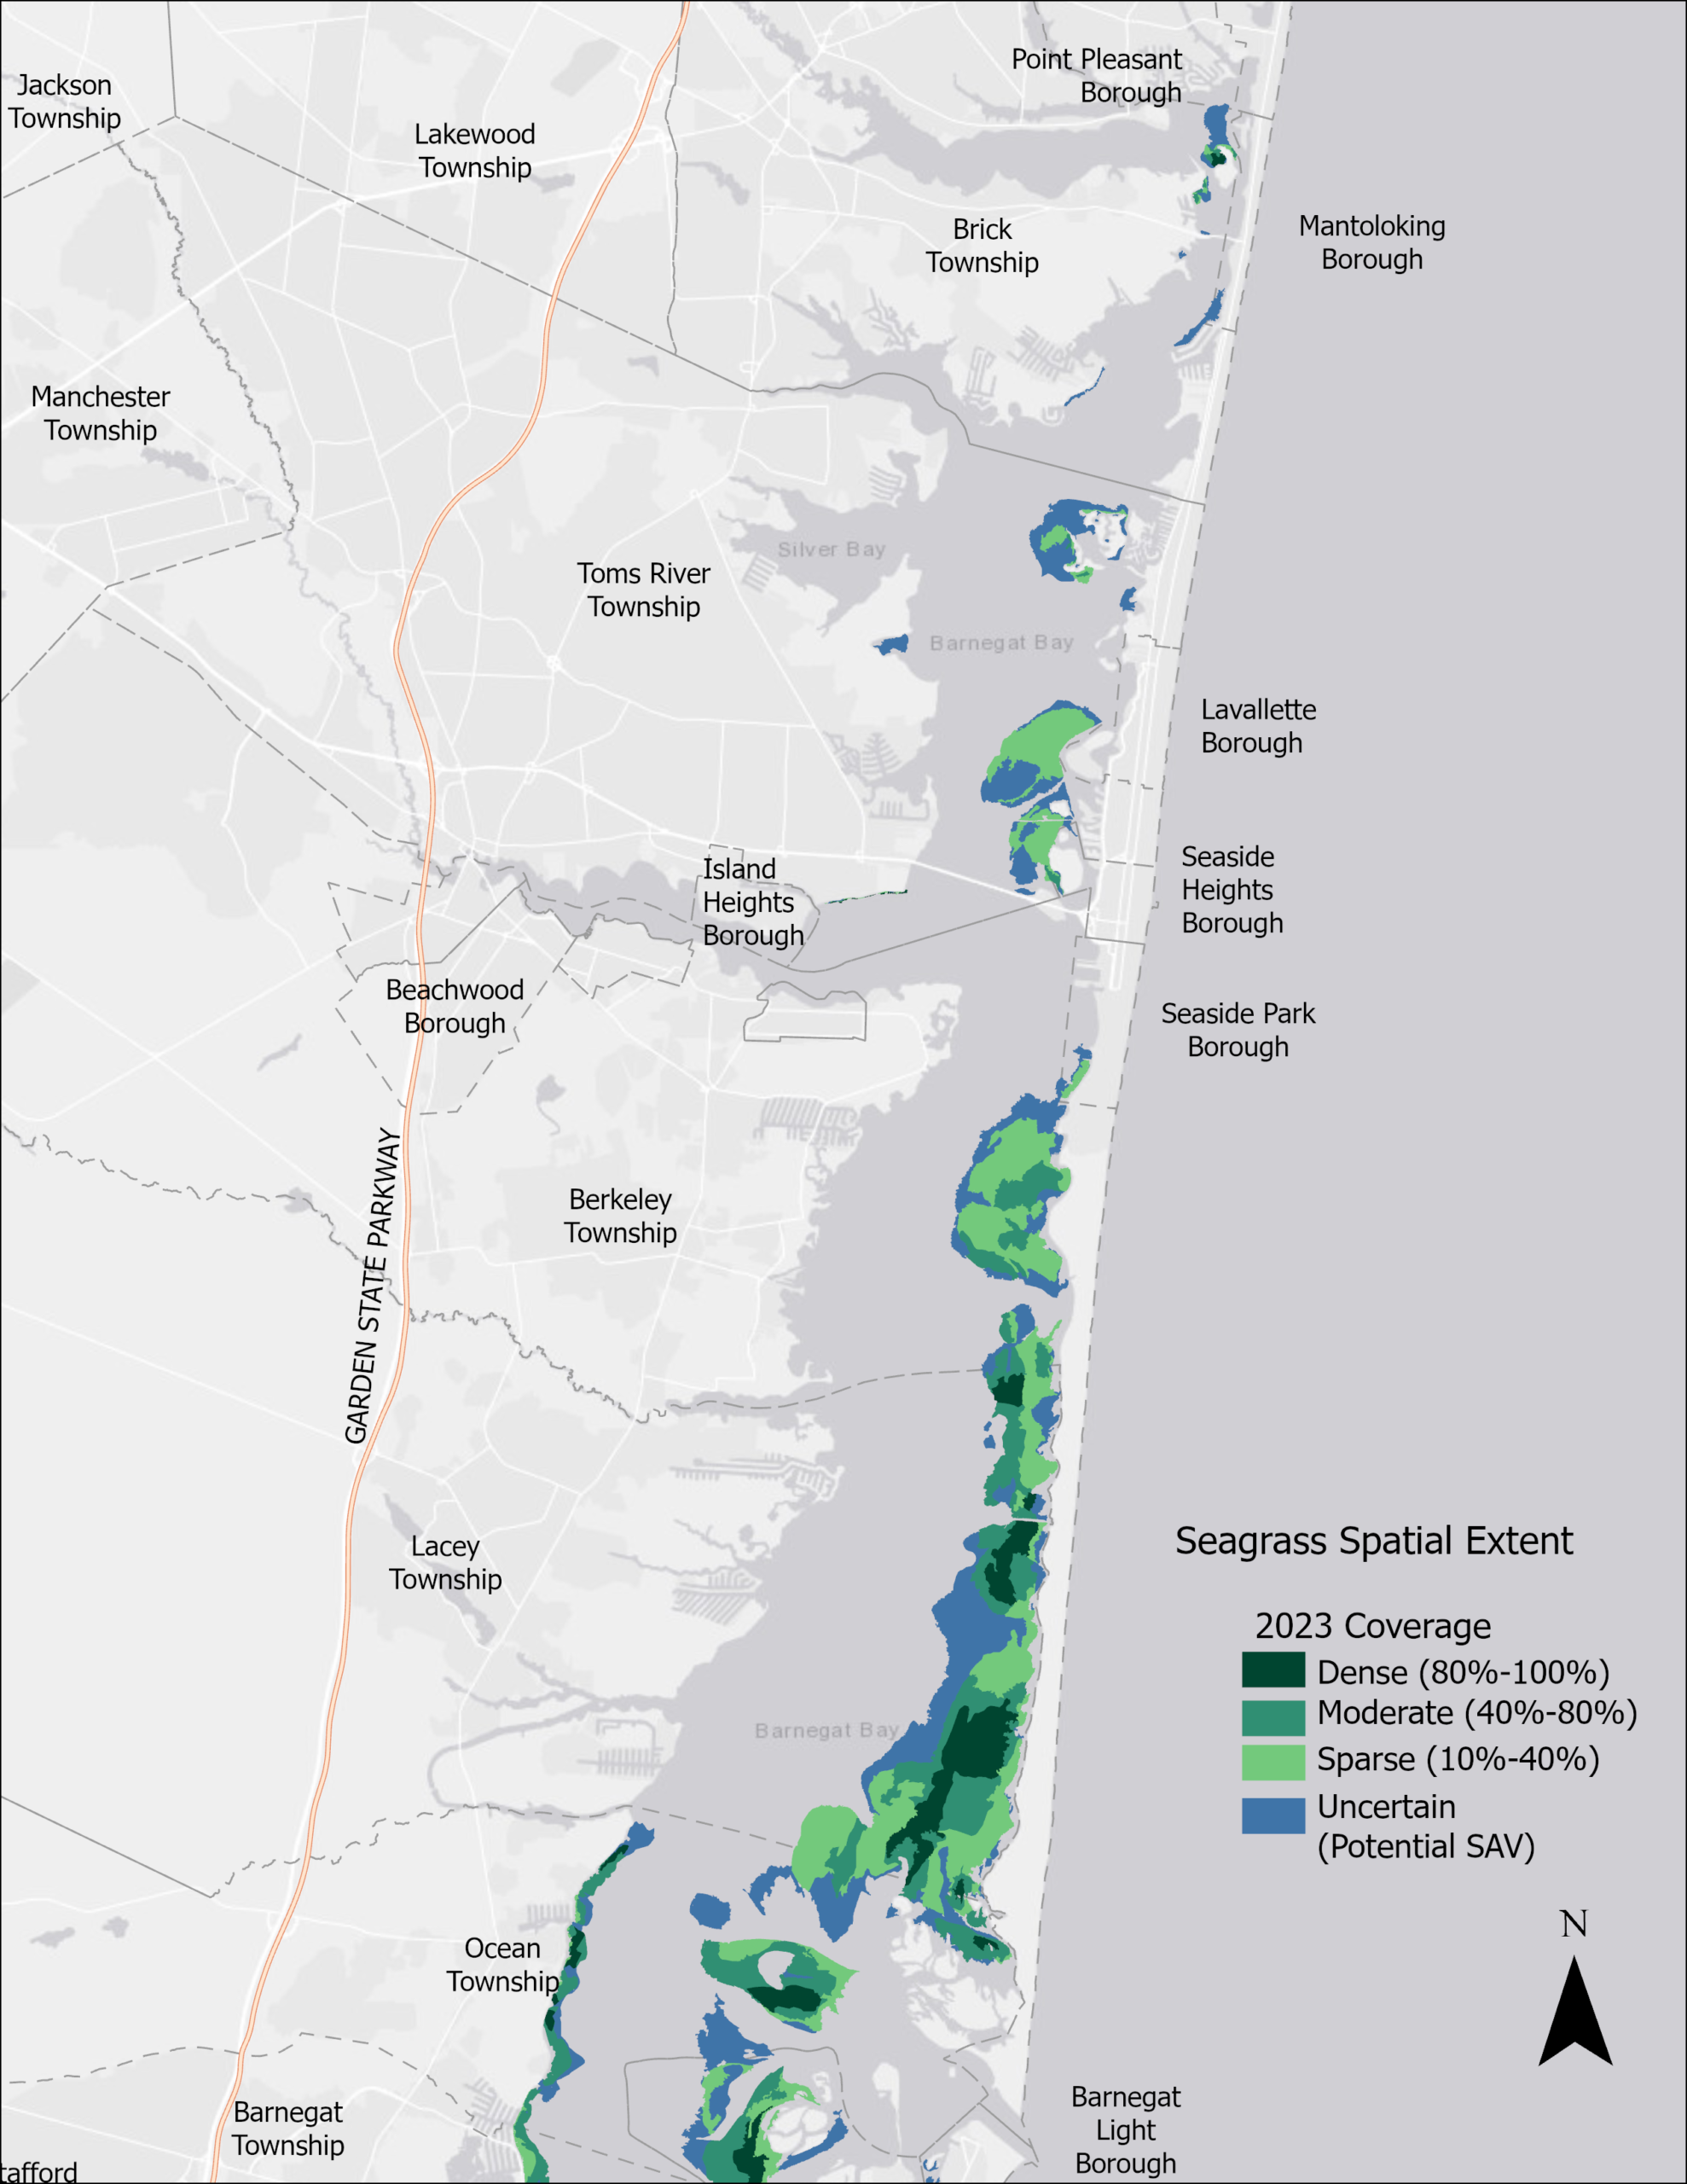
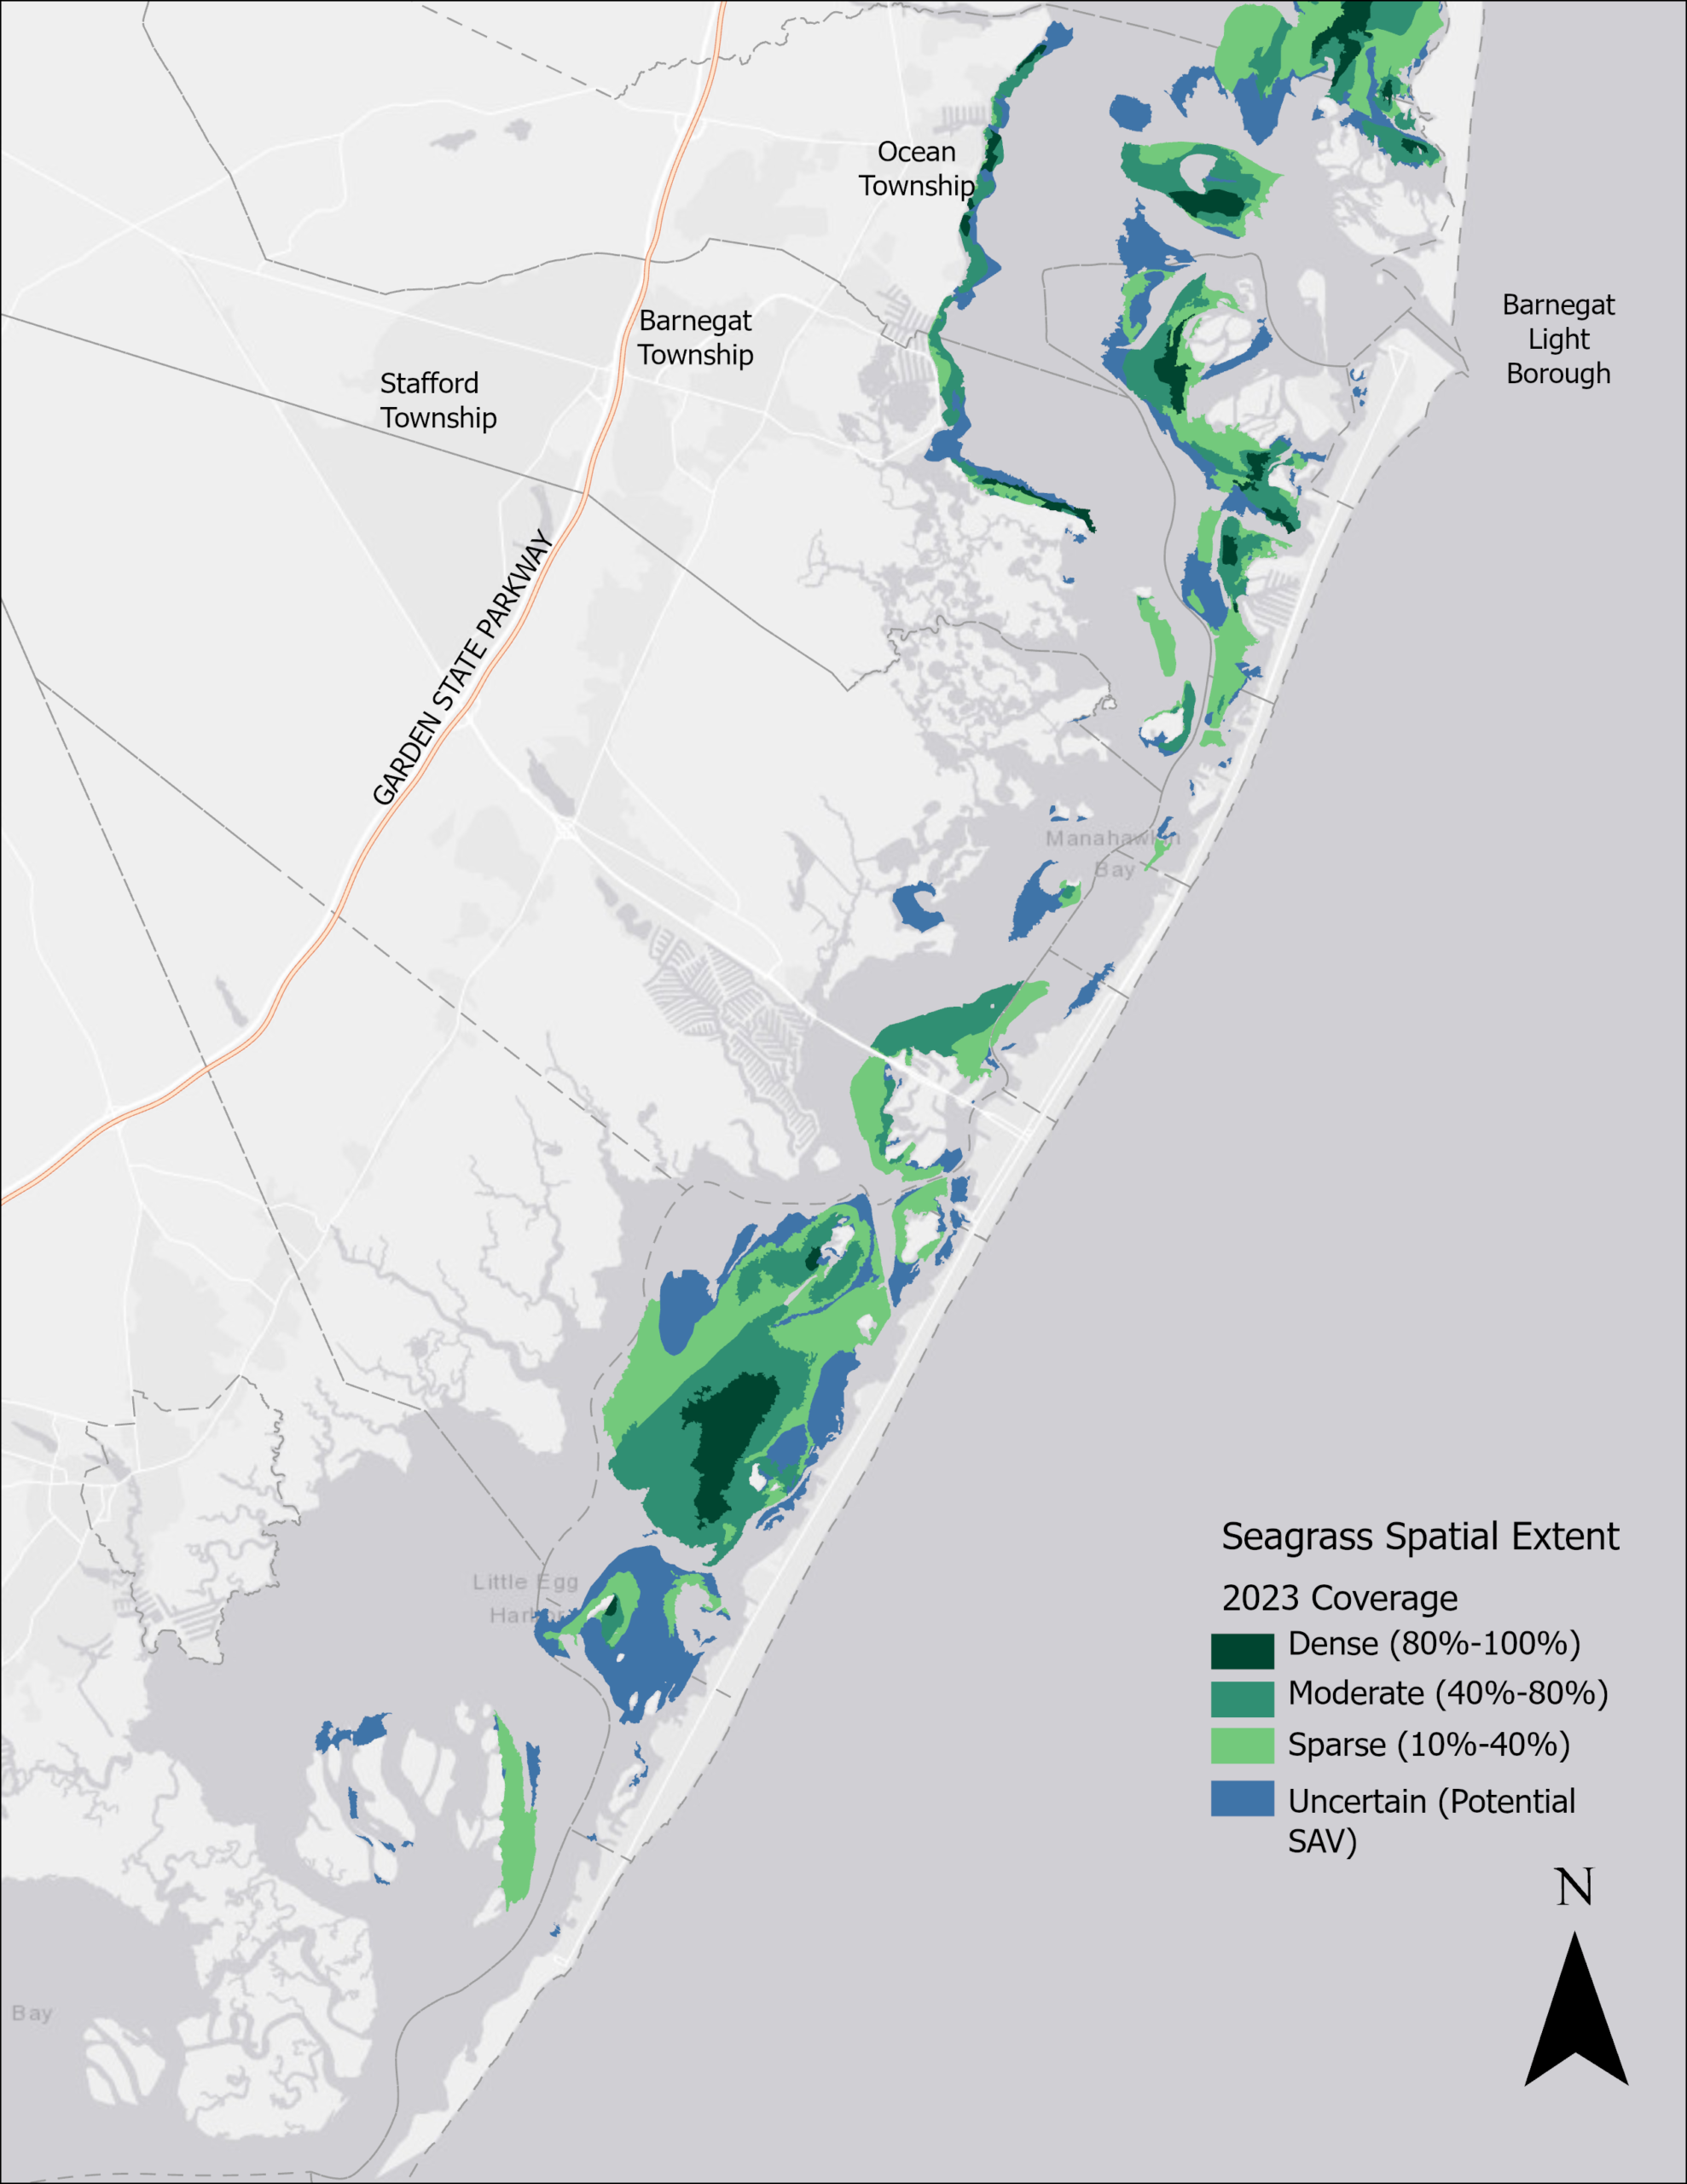
Funded by the NJDEP and BBP, a bay-wide seagrass survey was completed in 2023 through a collaboration between Rutgers University and Stockton University (Figures 7-8). These assessments typically rely on spring aerial photography when biomass is at its peak. However, unprecedented wildfire smoke and inclement weather delayed the 2023 data collection until autumn, a period when these underwater beds naturally decline. Additional weather complications during the fall flights introduced greater uncertainty in identifying the meadows. Consequently, while new acreage estimates were successfully produced, direct comparisons to historical datasets are currently inappropriate.
A total of 10,991 acres of seagrass were mapped during this cycle, representing a decrease of roughly 2,000 acres compared to 2009. However, an additional 5,000 acres were classified as uncertain or potential habitat. Because the flights took place in the fall when seasonal coverage is lower, the 10,991 acres of mapped meadows likely represent a highly conservative estimate.
TREND
Due to methodological differences between the 2009 and 2023 surveys, combined with a lack of intermediary data, a definitive trend cannot be determined.
KNOWLEDGE GAPS
A recurring spring assessment utilizing clear, high-quality imagery of submerged aquatic vegetation (SAV) is essential to determine if the bay is on track to maintain its seagrass targets. While the preliminary conservative estimate suggests an 18% decrease in acreage over the past 14 years, the extensive size of the unverified zones means that as mapping is refined, final totals may actually exceed the target.
To resolve this uncertainty, the NJDEP and Rutgers University are collaborating to deliver a more precise assessment in the near future. Significant funding has been directed toward mapping and researching these vital habitats, with active restoration initiatives and supporting studies scheduled to begin soon.
While tracking total acreage is critical, evaluating the qualitative condition of the meadows offers deeper insight into overall ecosystem health. Consequently, a secondary indicator, aboveground biomass, is utilized to evaluate the vitality of these beds, where higher biomass indicates more robust growth and superior habitat health.
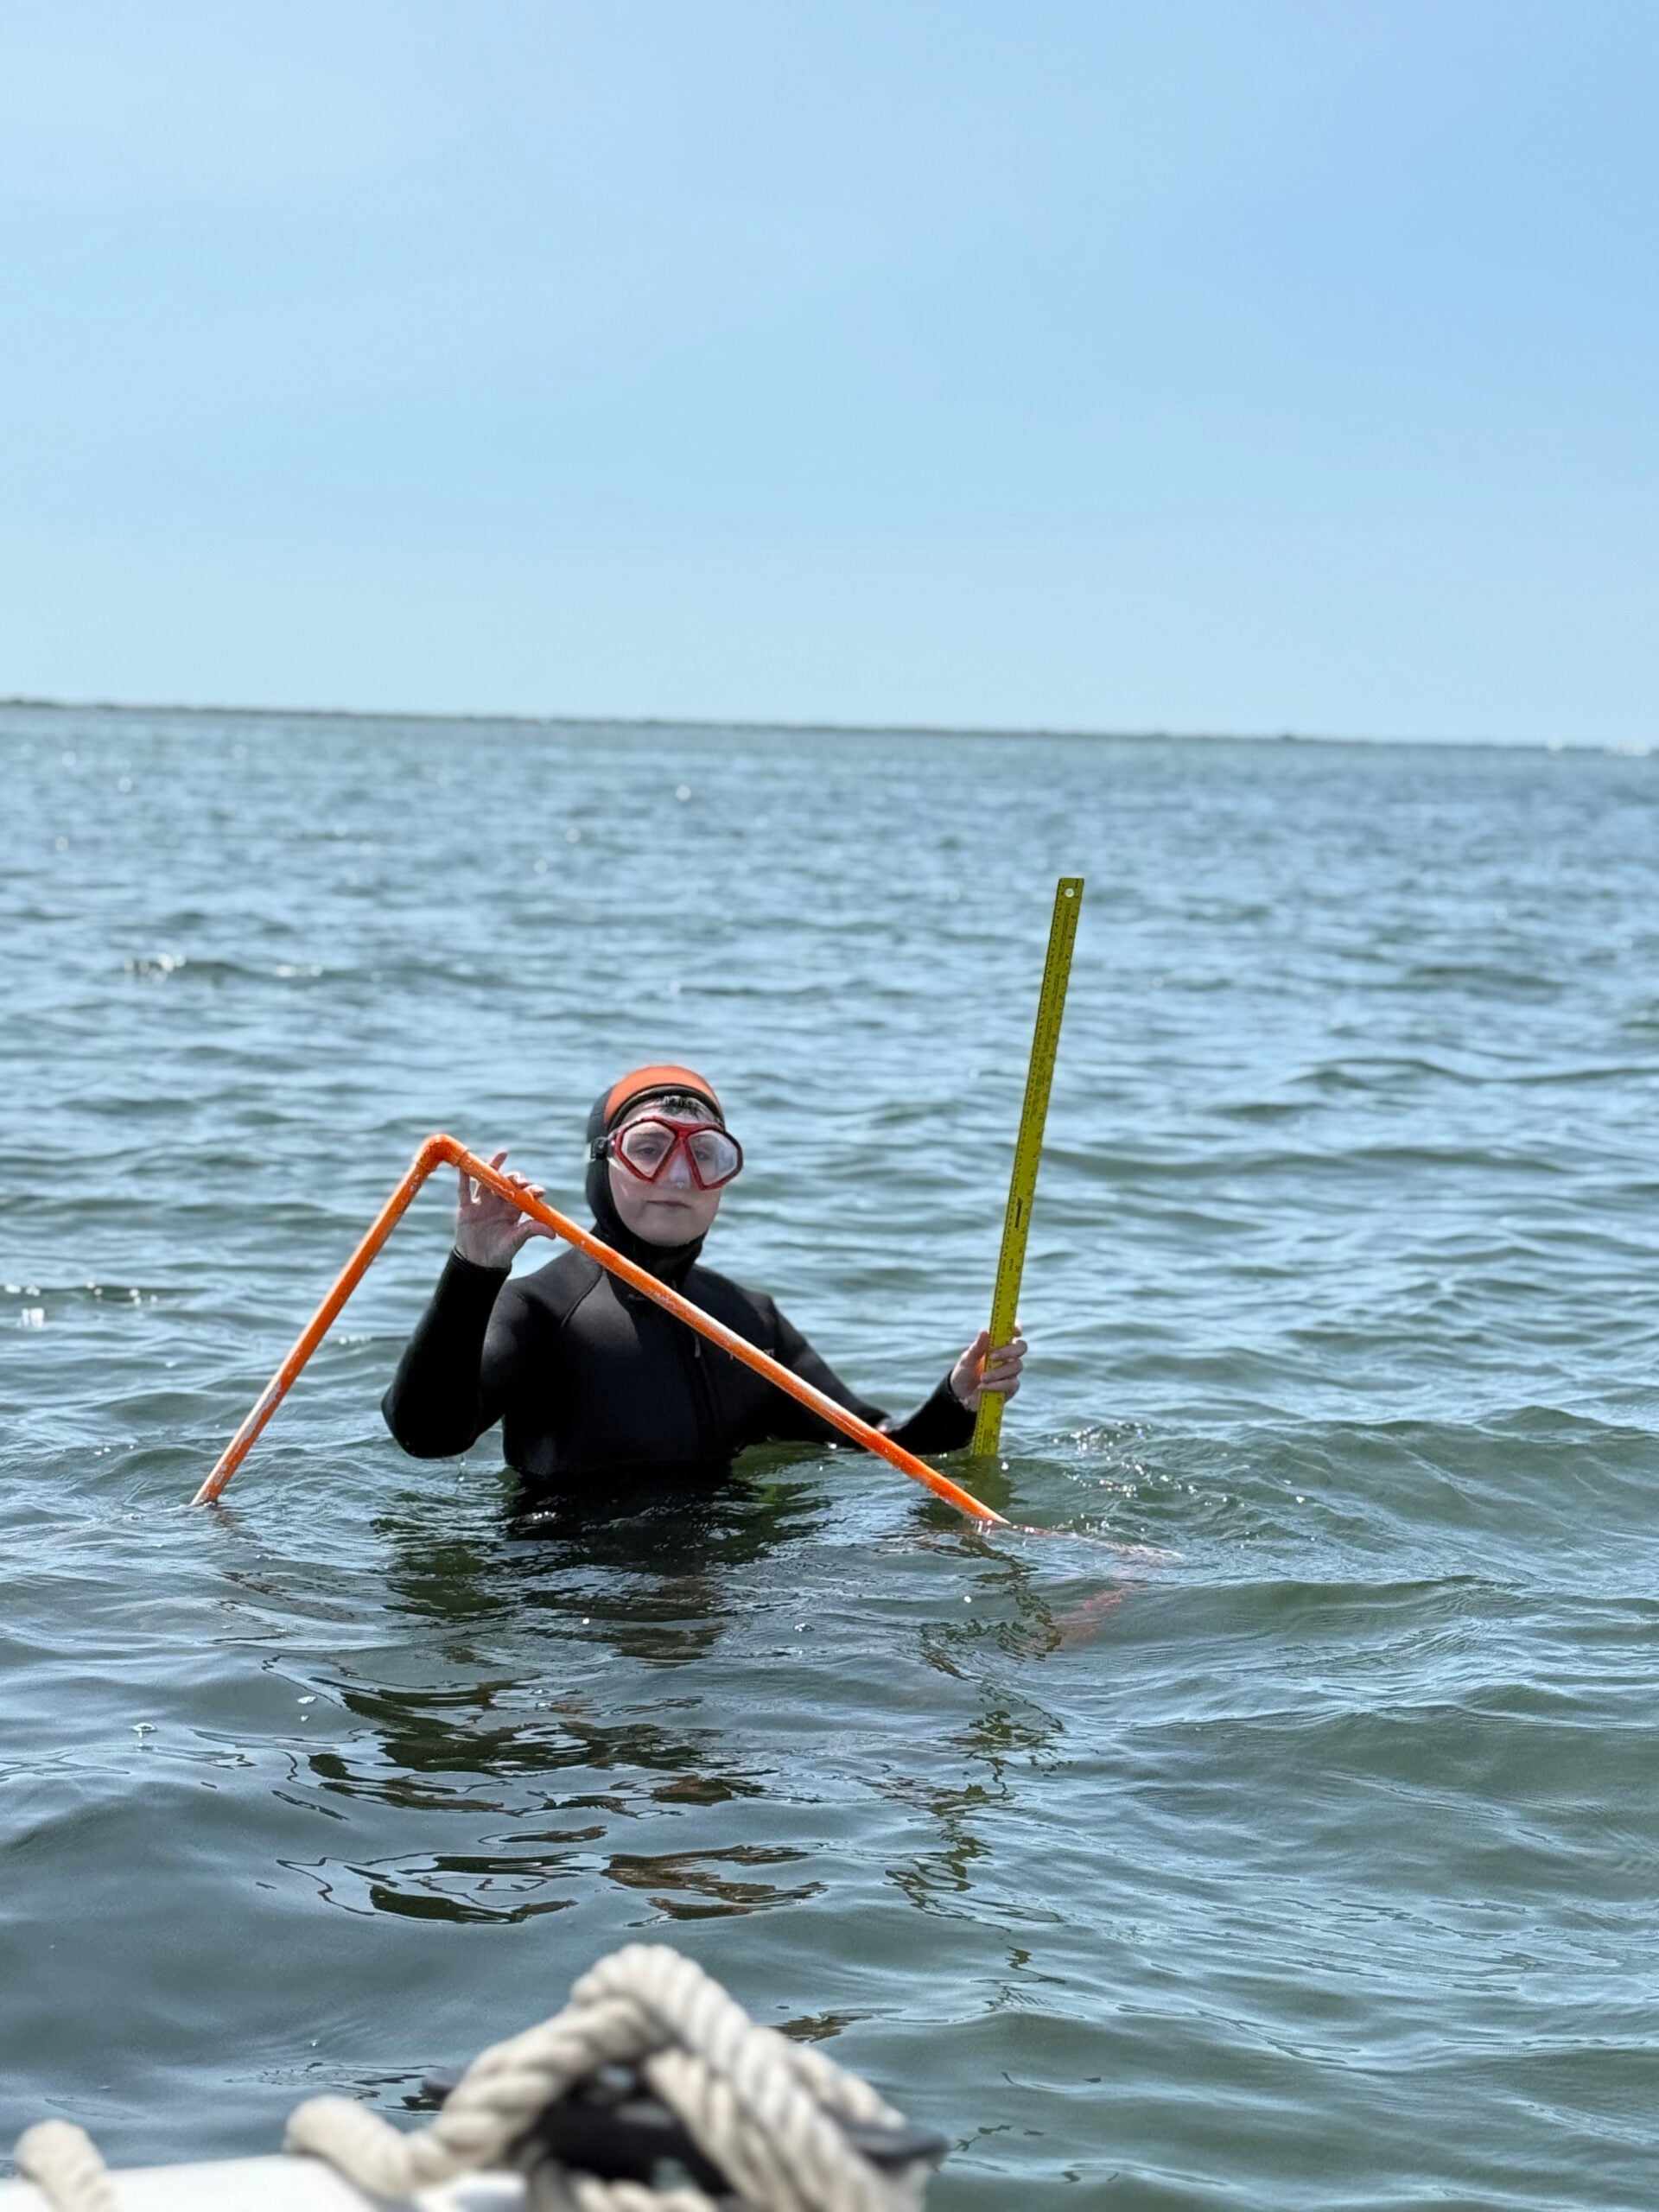
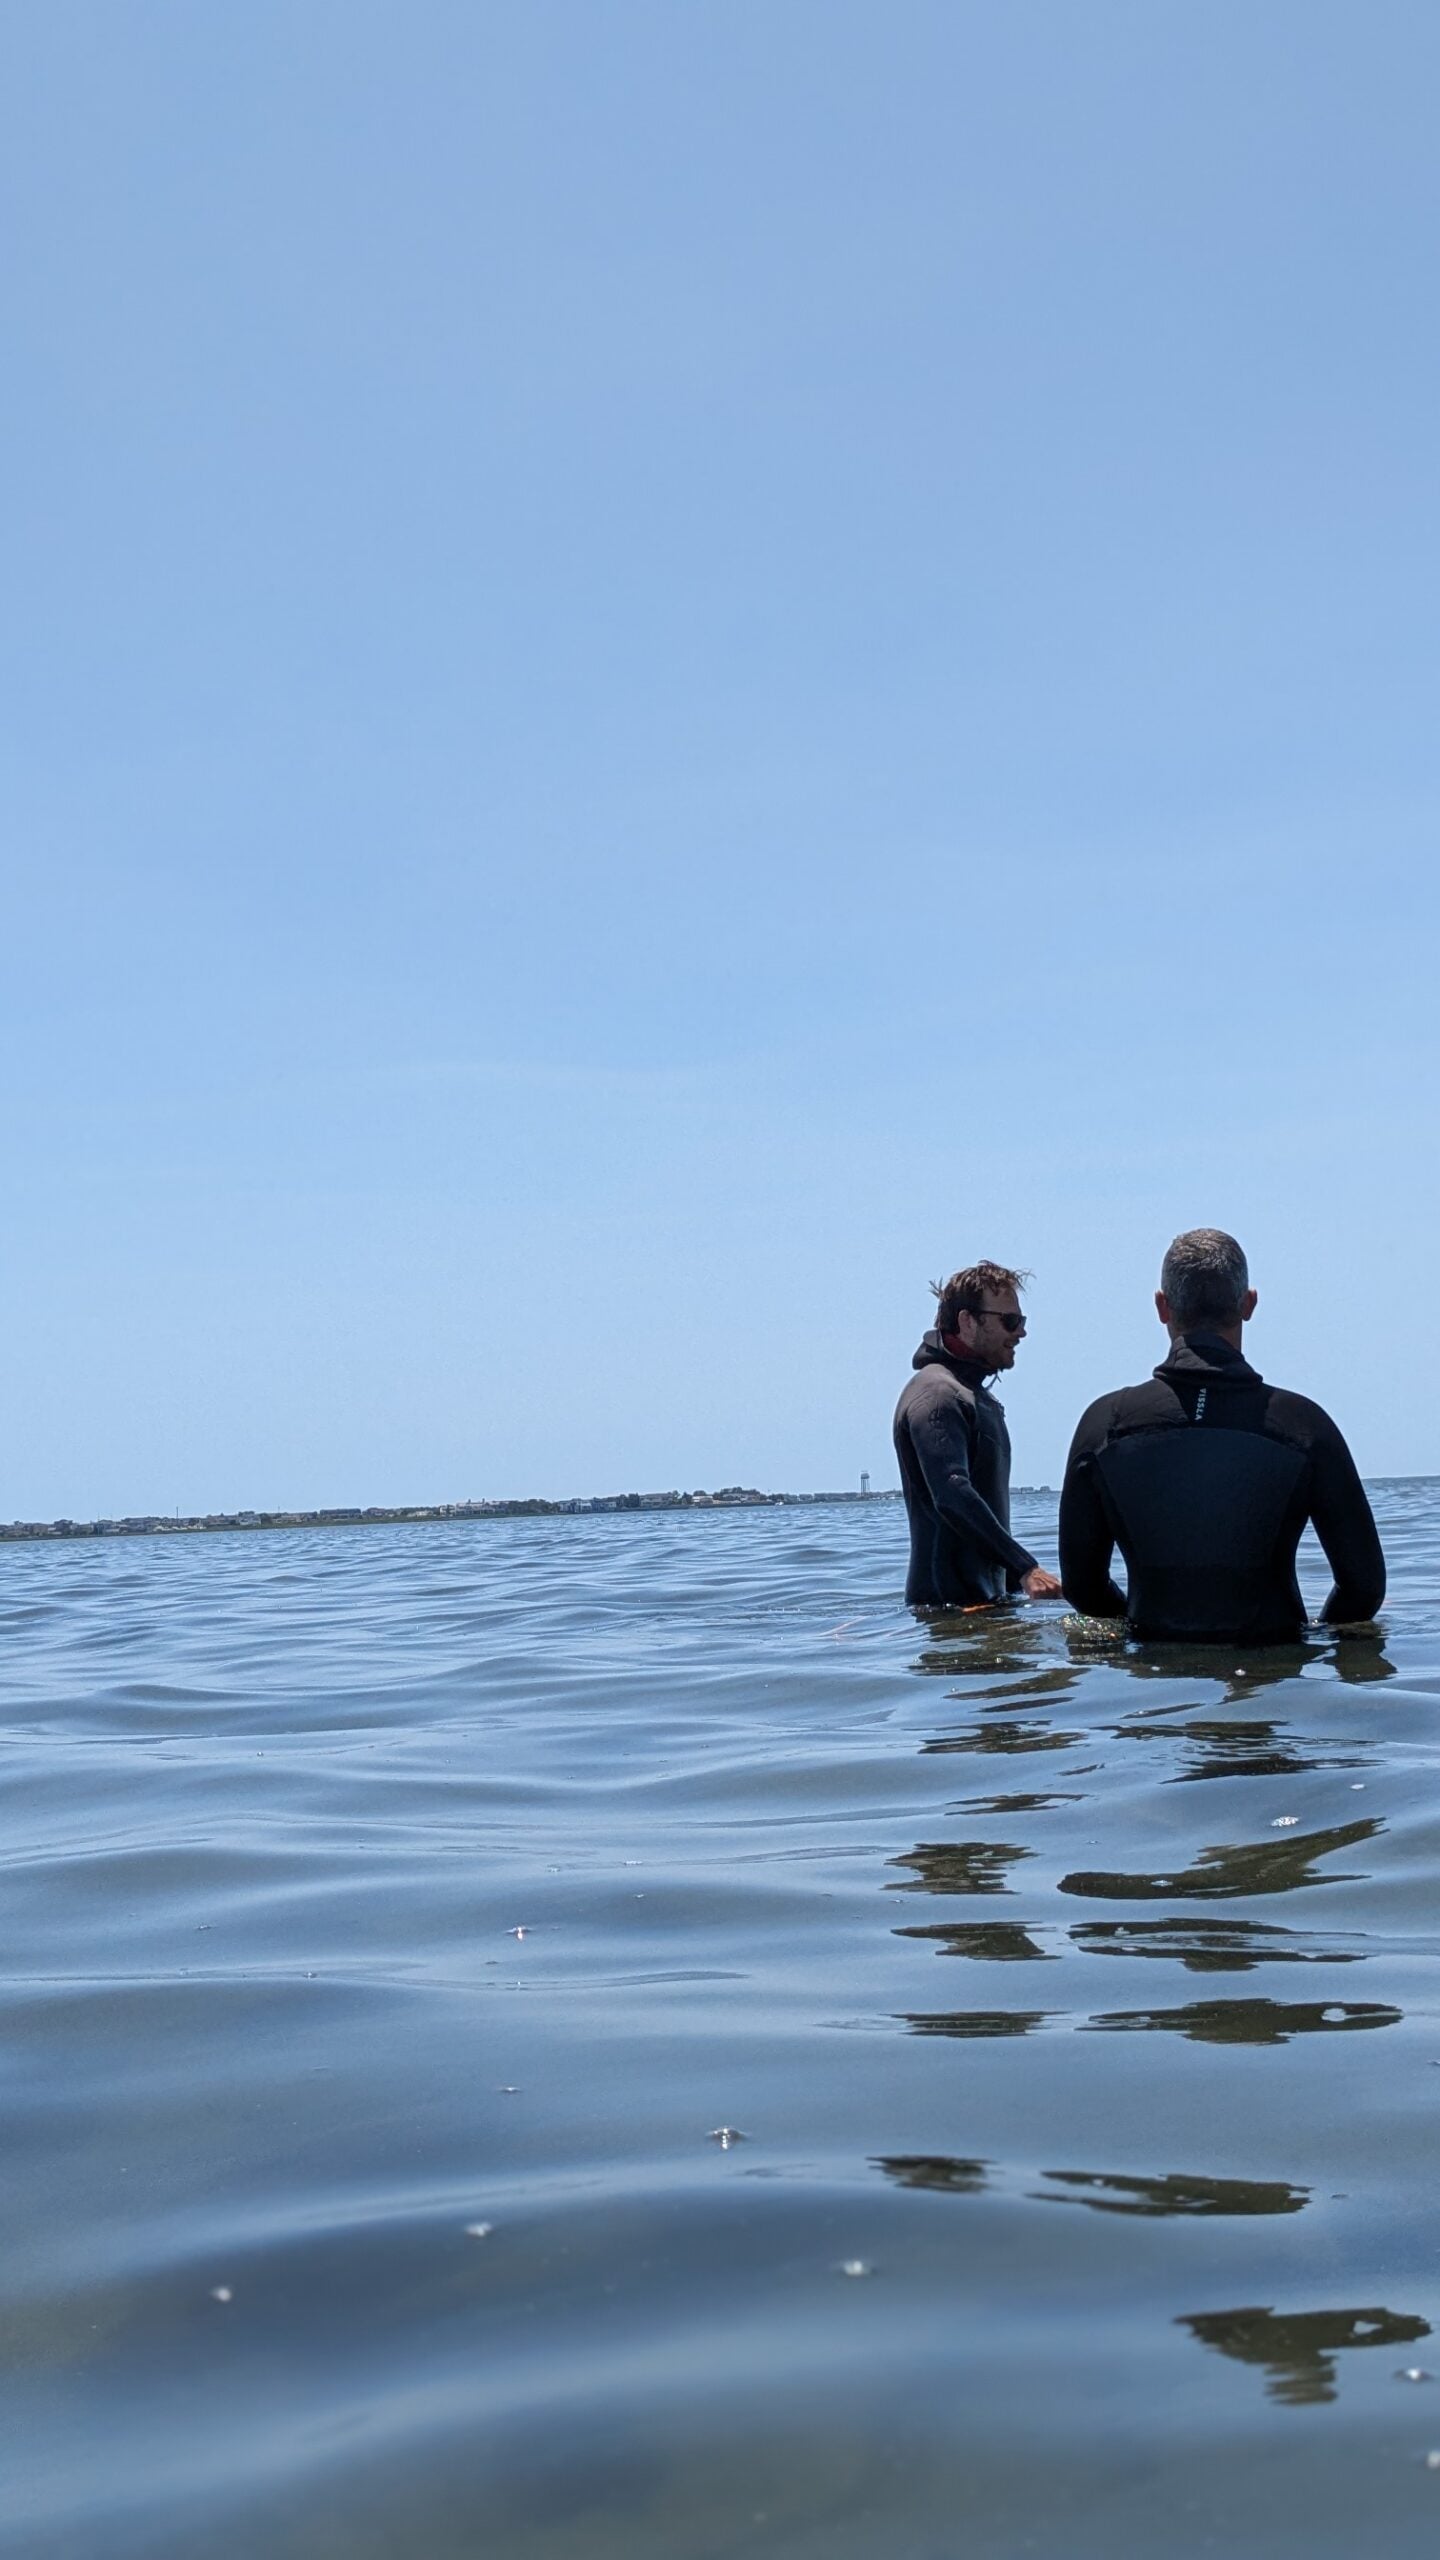
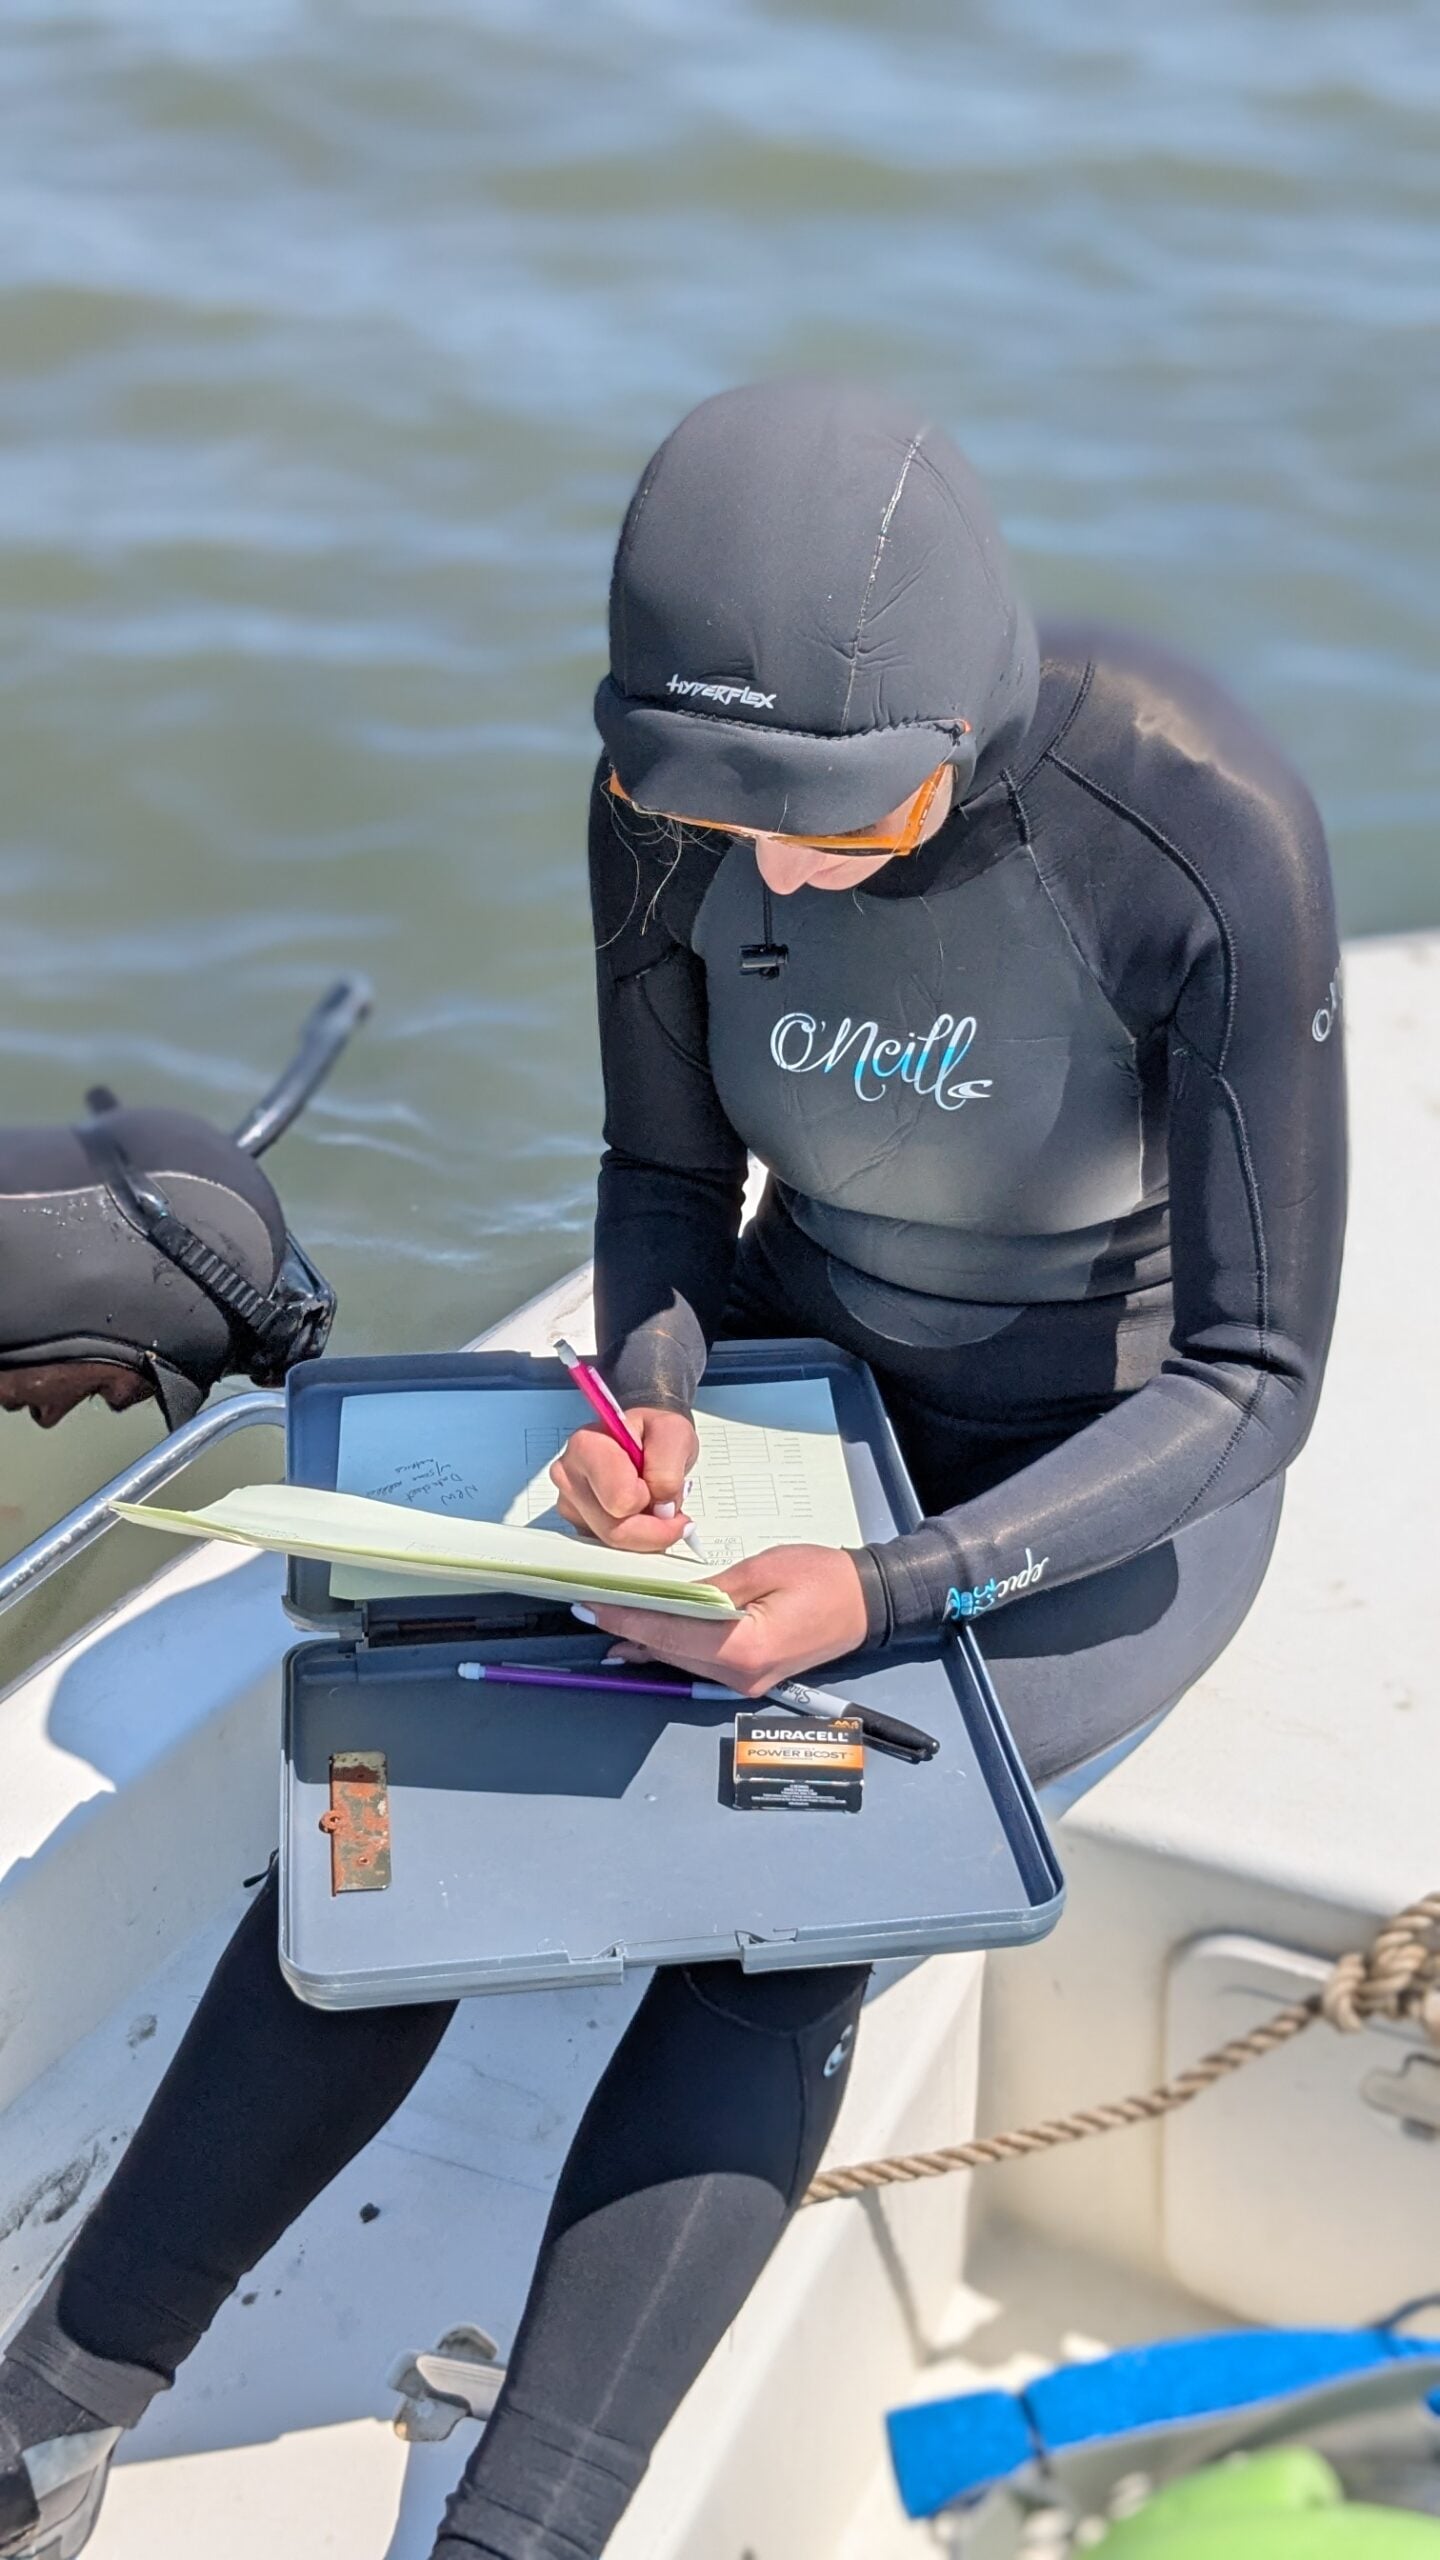
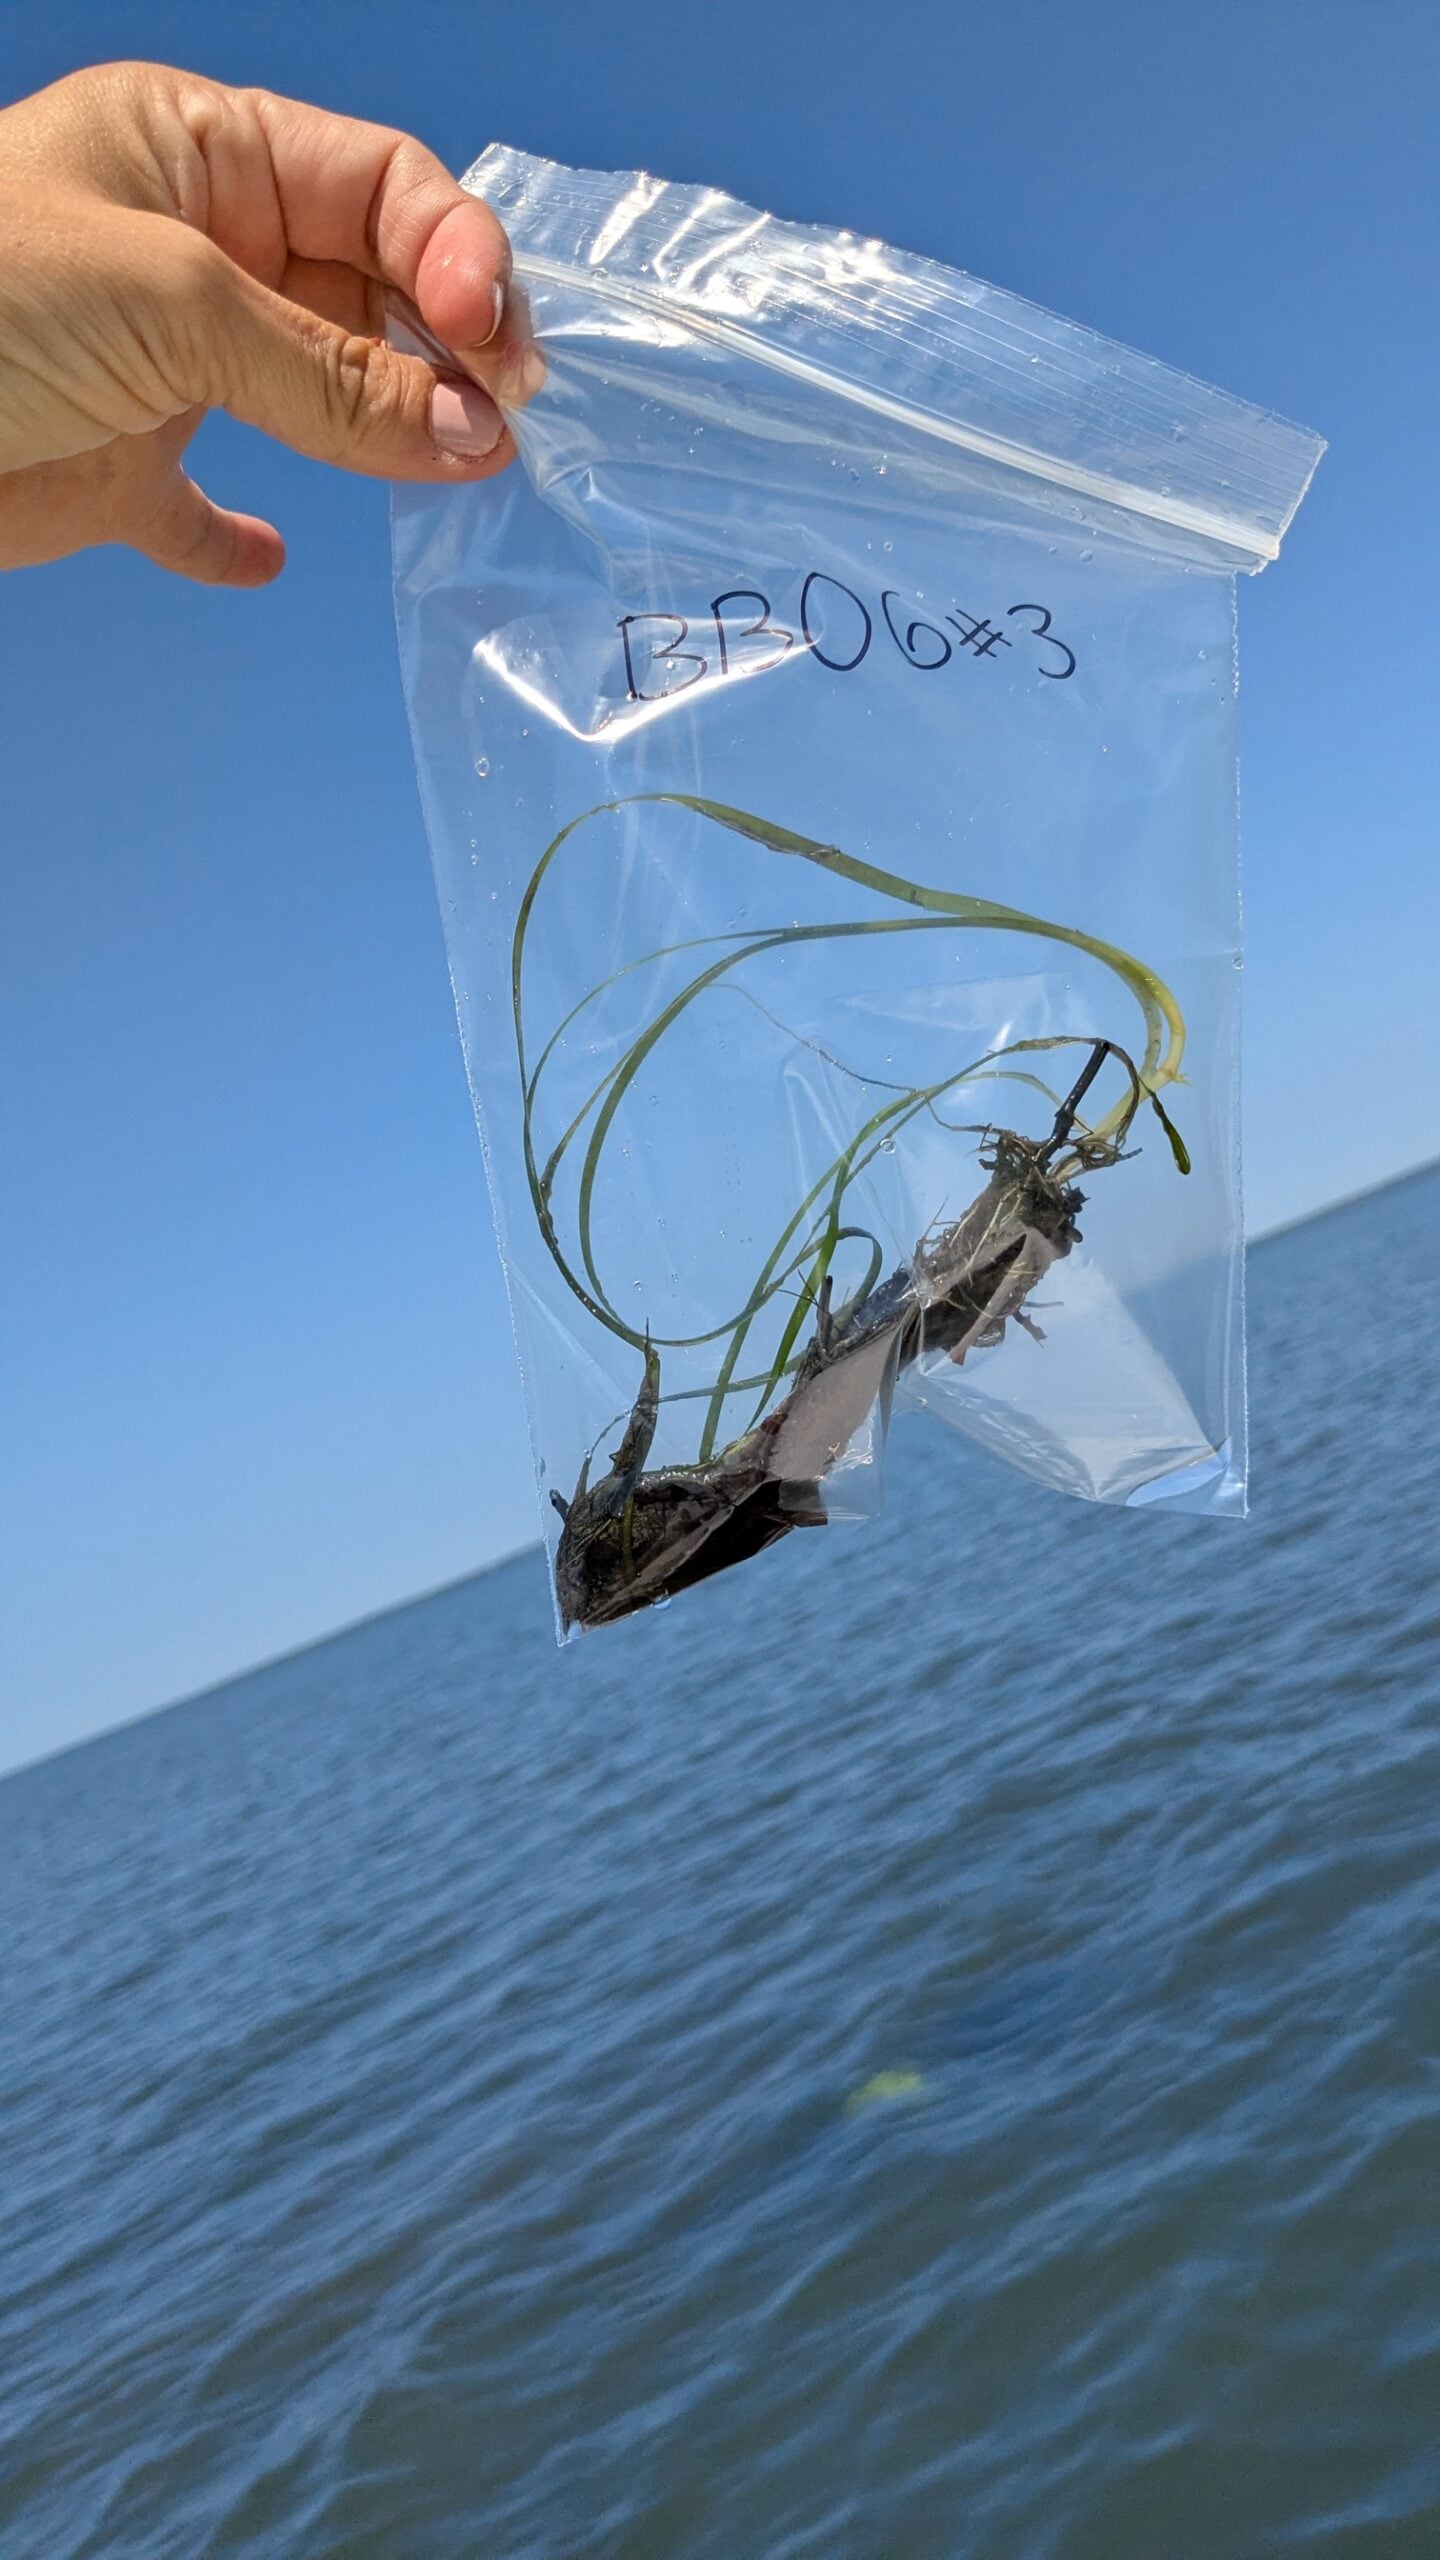
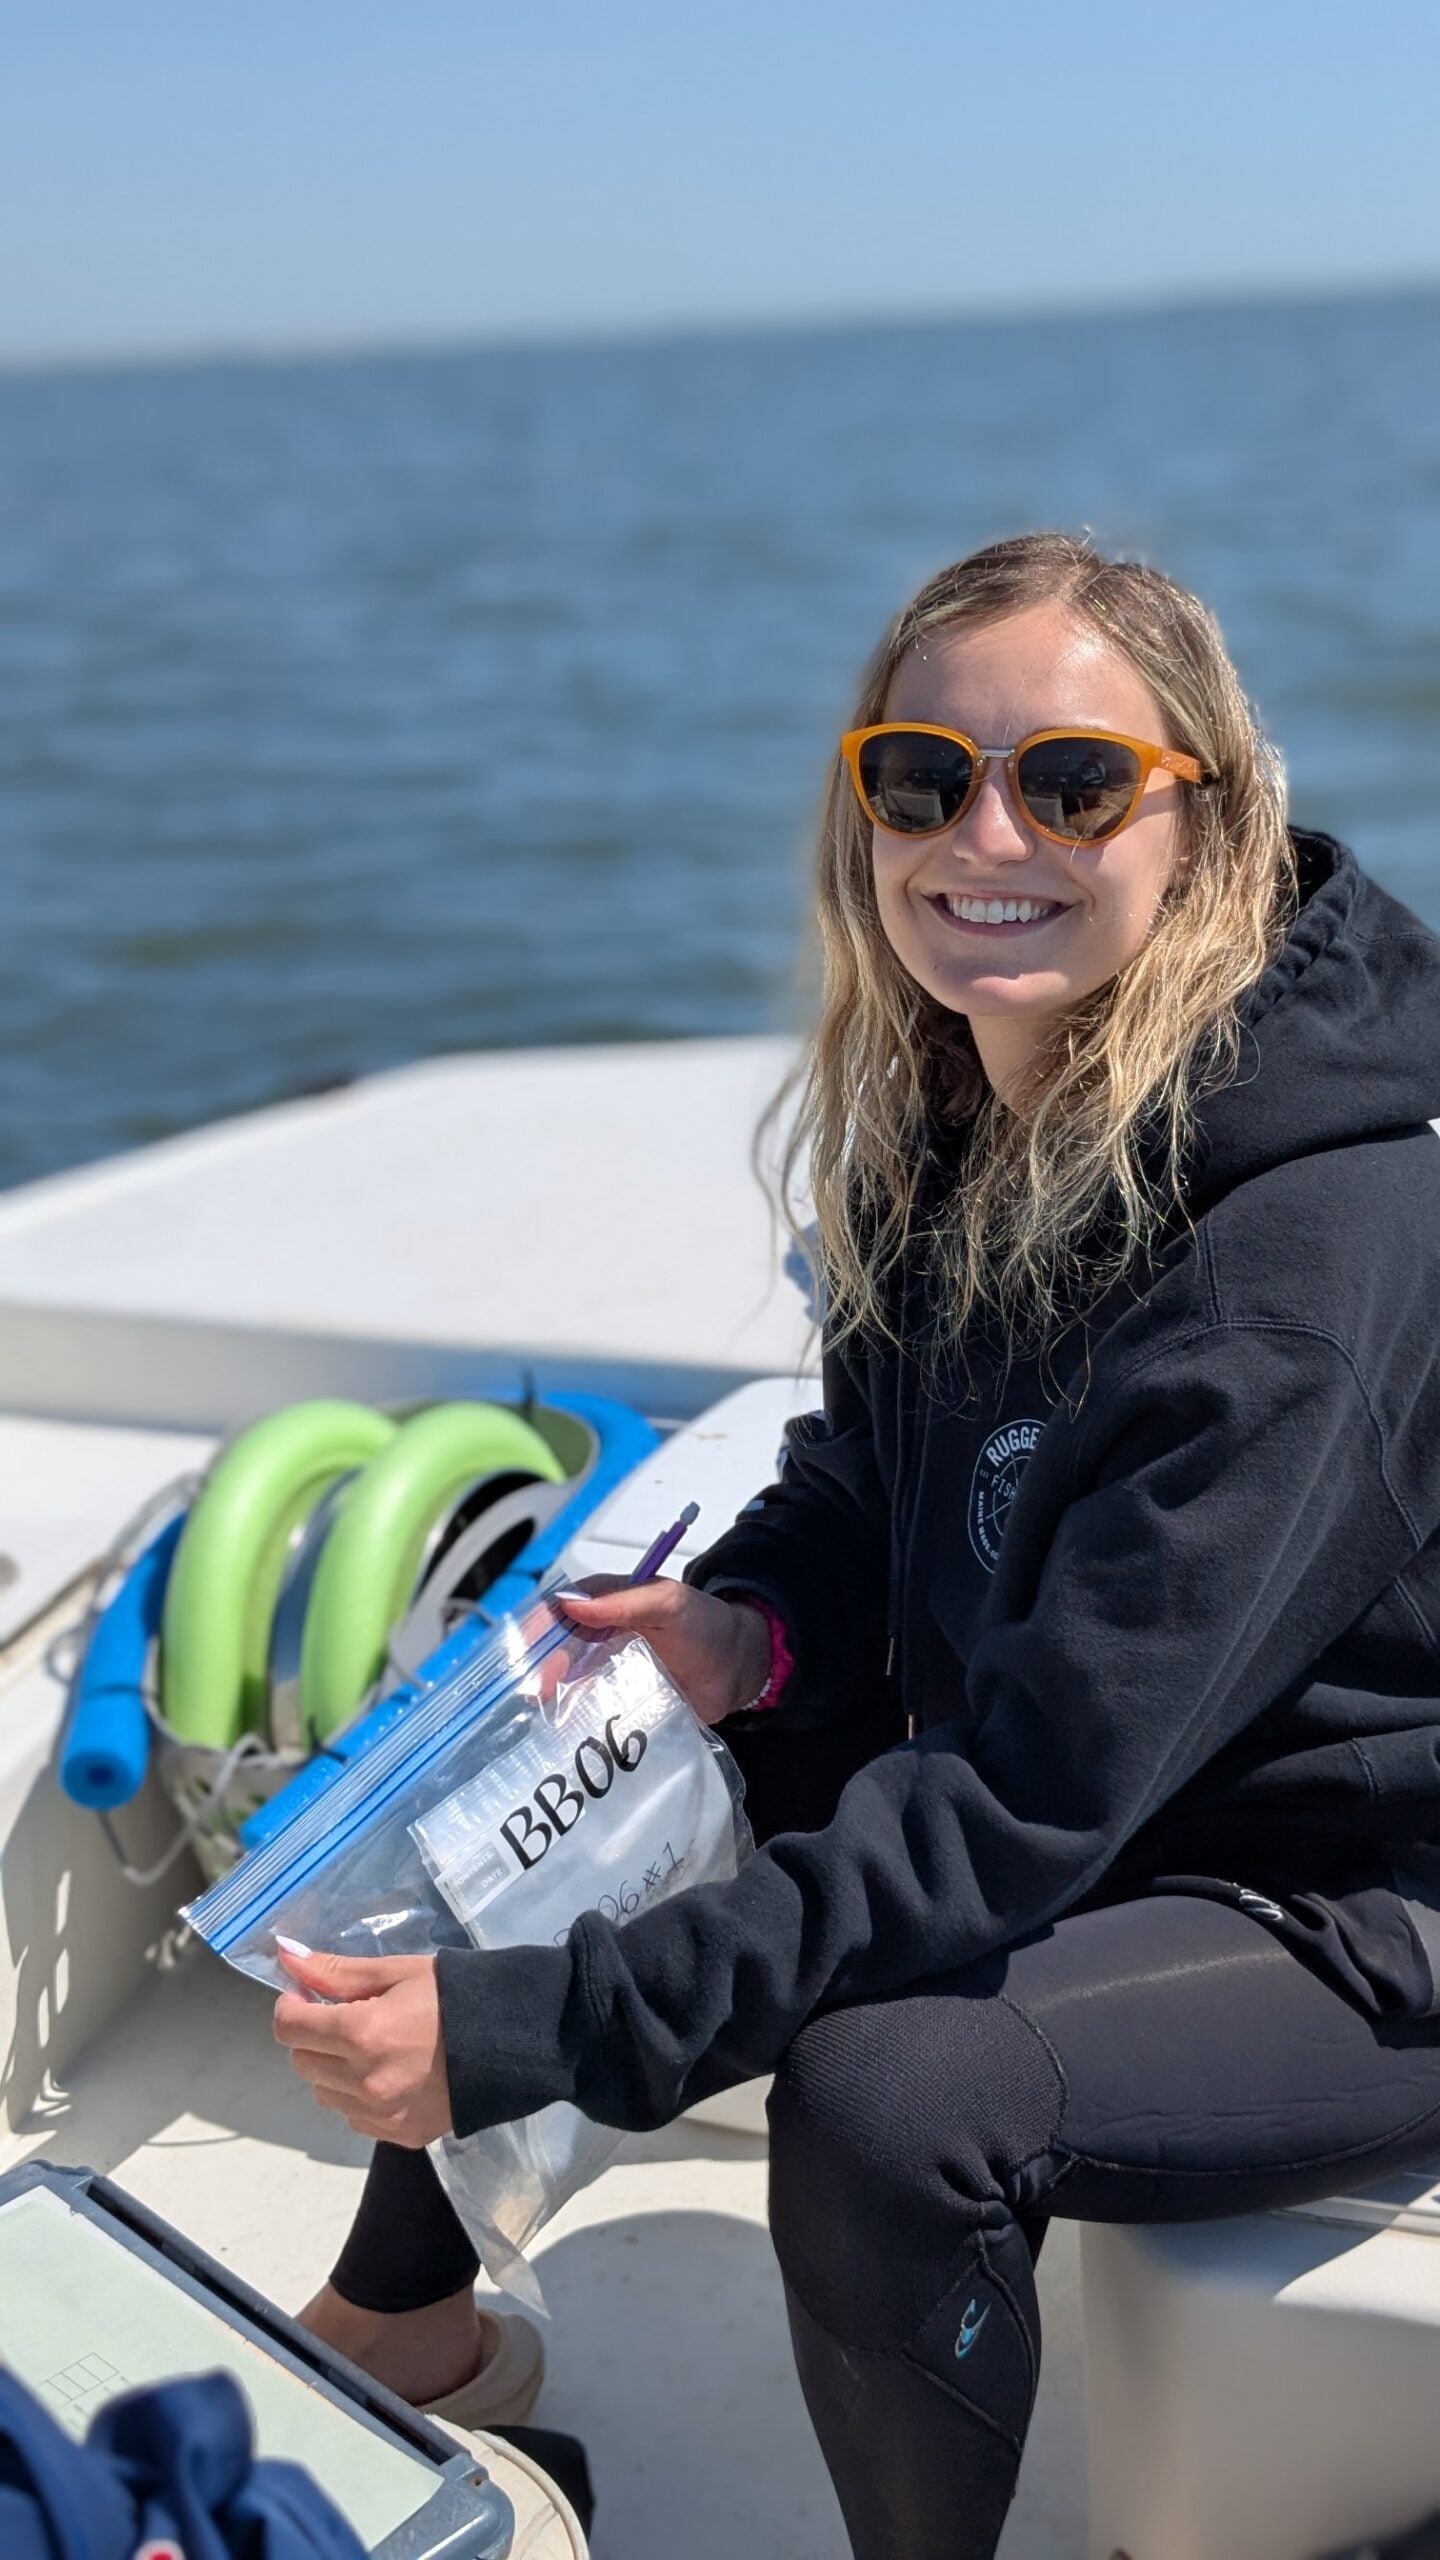
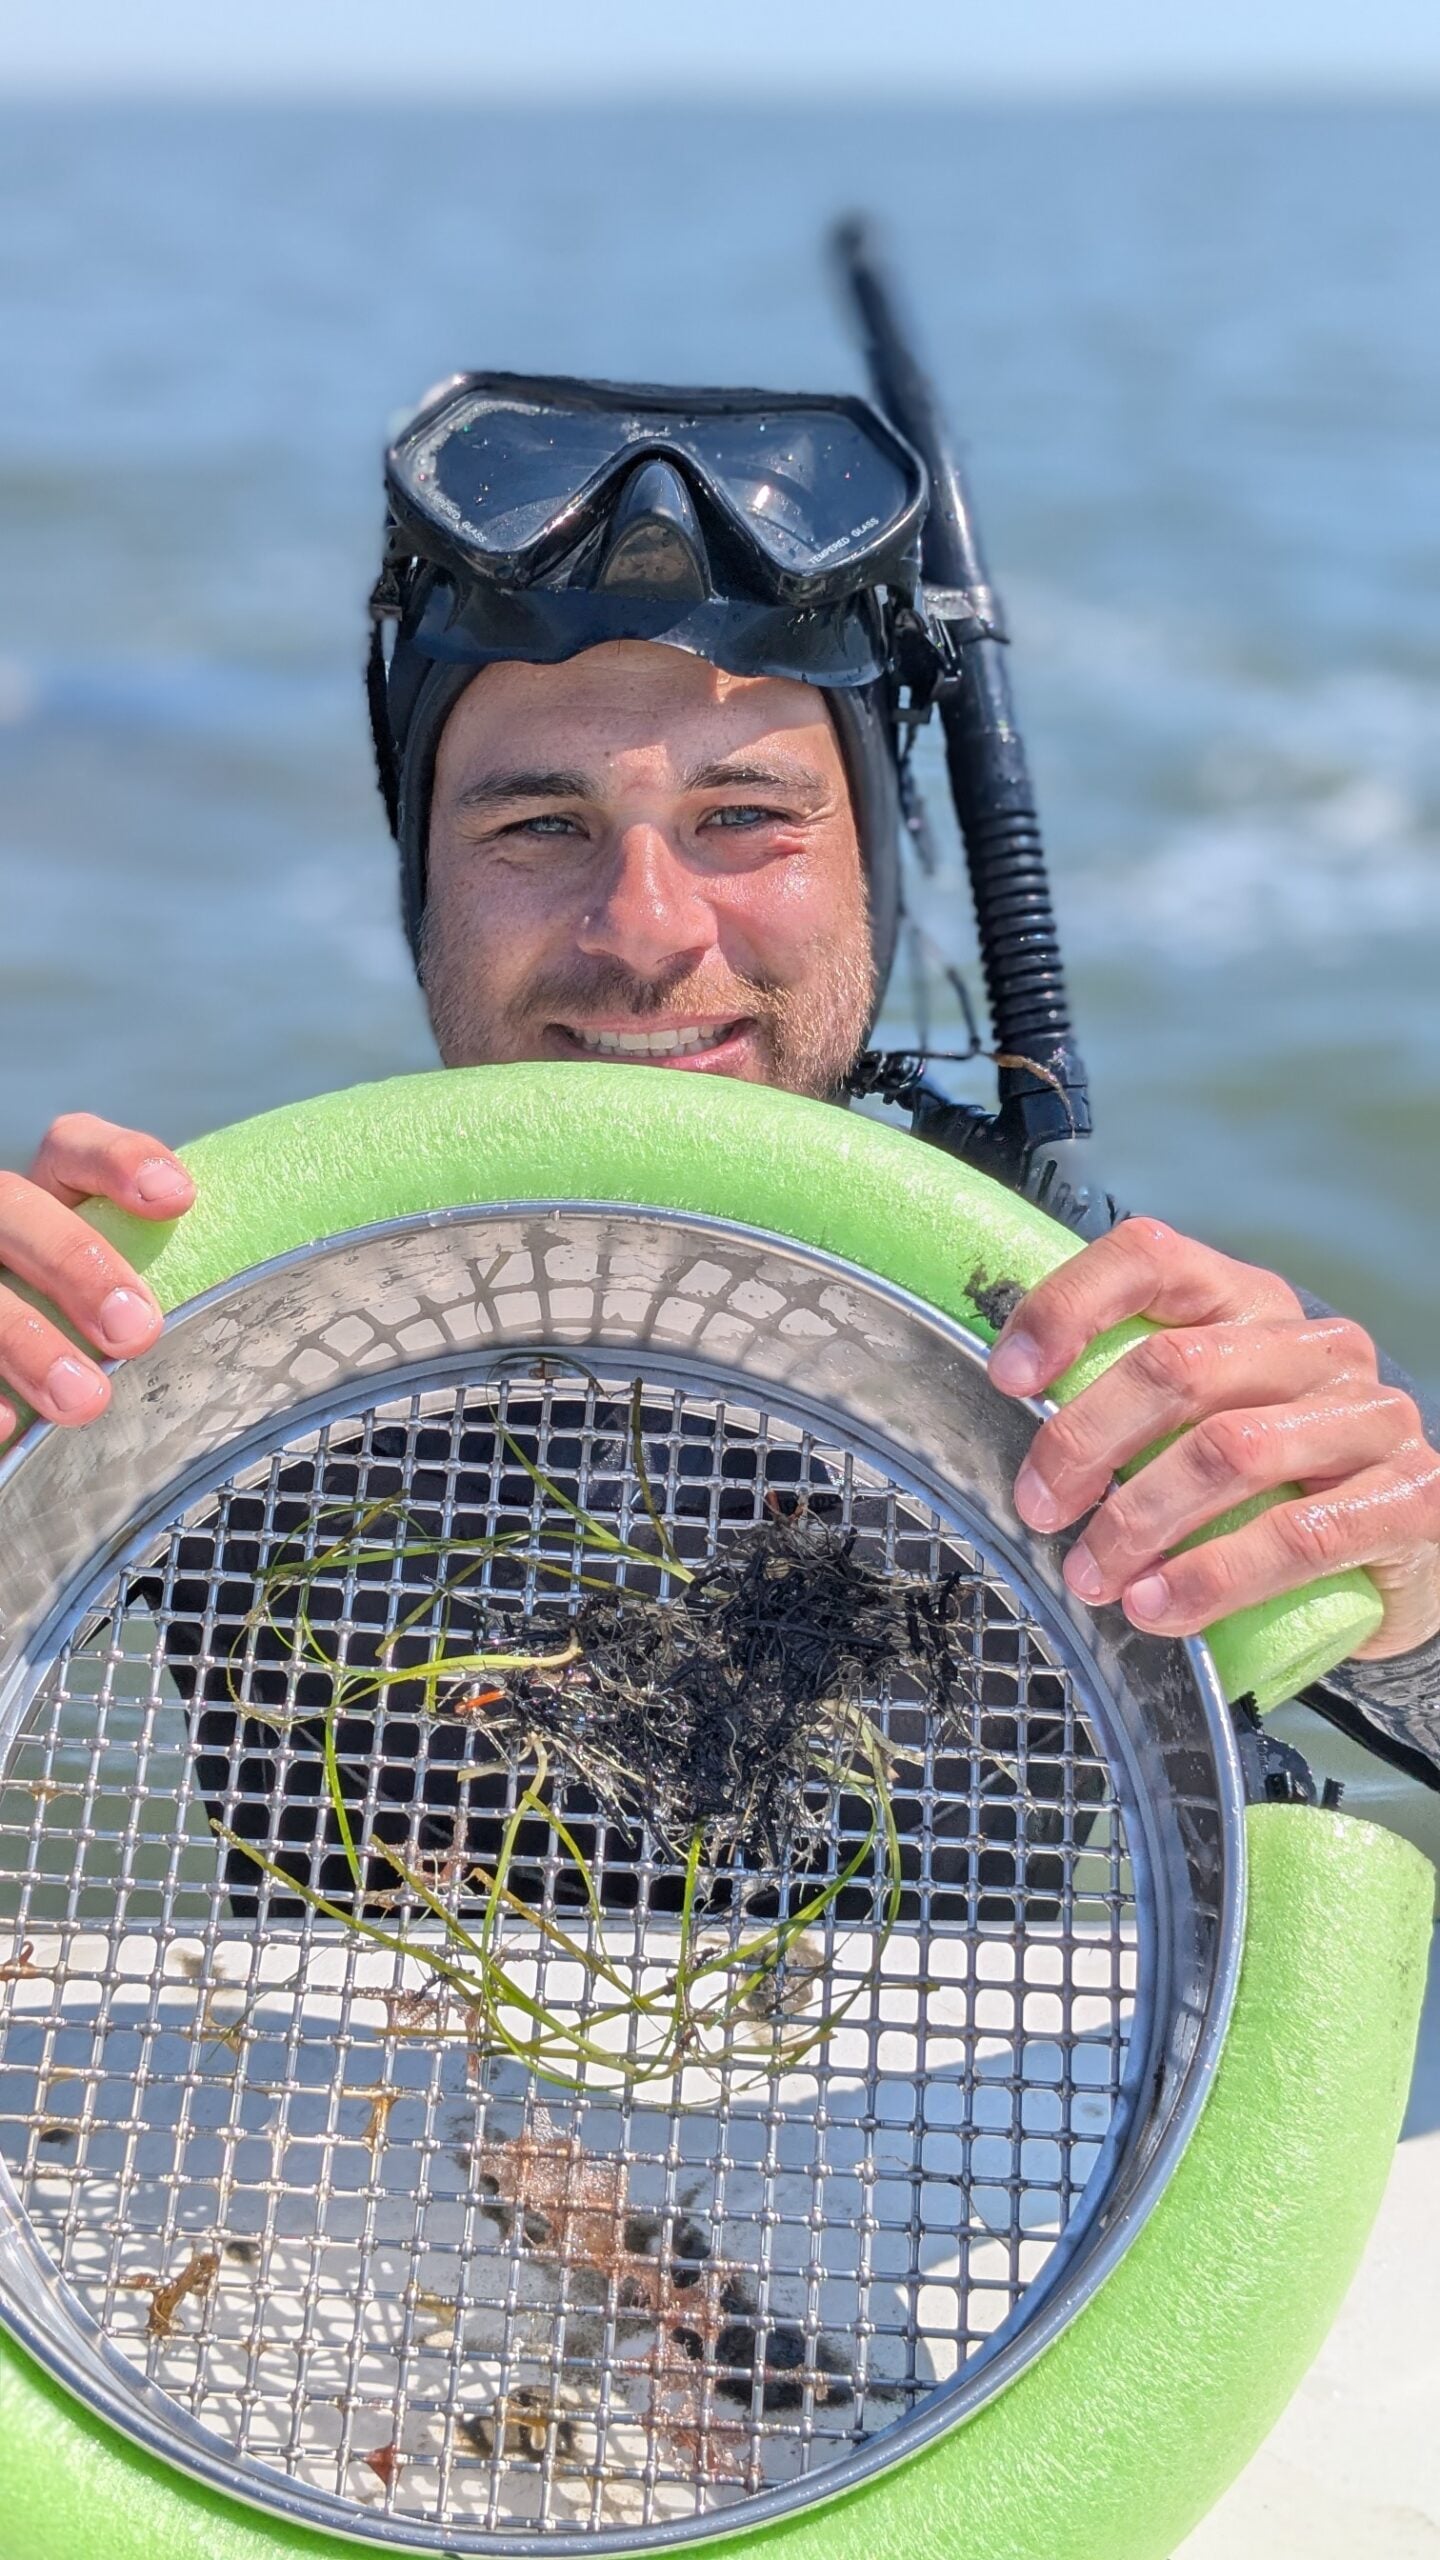
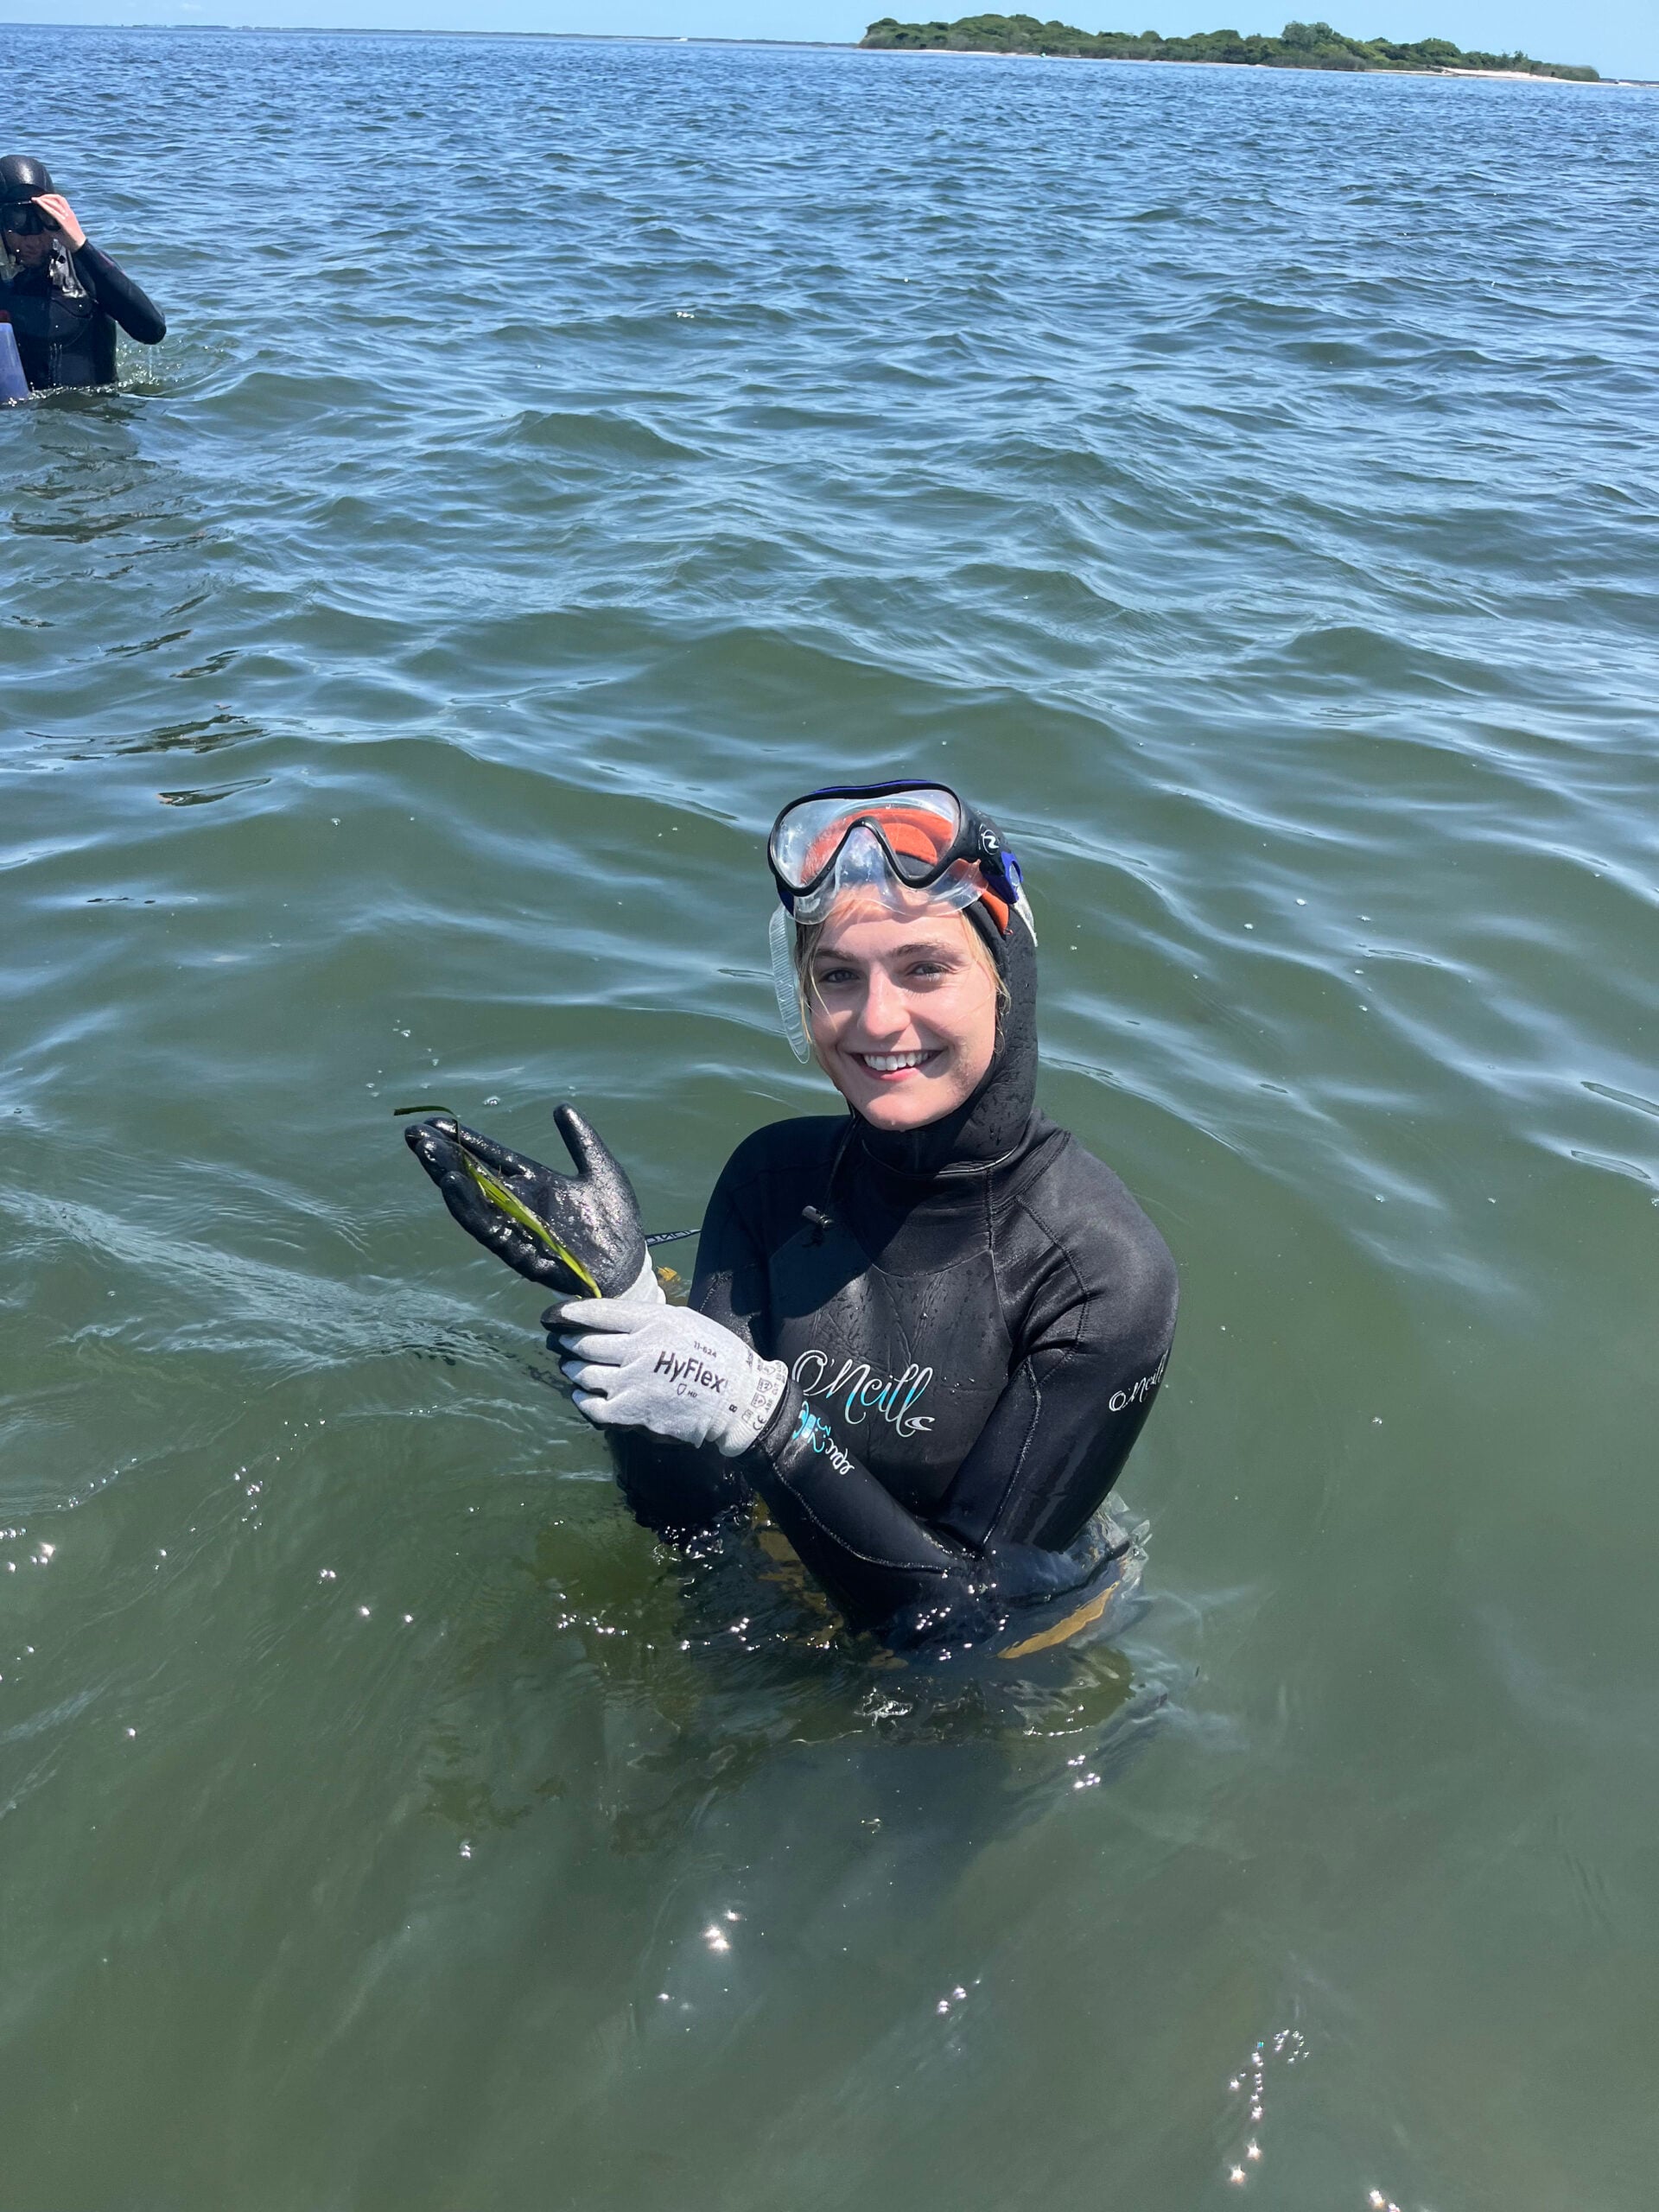

Extent of Seagrass Meadows (Eelgrass and Widgeon Grass) from Point Pleasant to Little Egg Inlet
SECONDARY INDICATOR: SUBMERGED AQUATIC VEGETATION DEMOGRAPHICS
STATUS
Bay-wide surveys of seagrass bed biomass revealed a reduction in both Zostera and Ruppia spring time aboveground biomass during this period (2023 and 2025), compared to the surveys from the previous five-year period. Biomass in 2025 was much lower than what was measured in 2021 or 2023 for both species in all three Bay segments (Figures 5-6). The decrease in Zostera in the central and southern portions of the Bay was particularly pronounced.
In 2023 aboveground biomass was 128 g/m2 in the central Bay while in 2025 the biomass was 43 g/m2. In 2023 the biomass was 90 g/m2 in the southern Bay, while in 2025 the biomass was 30 g/m2. The cause of these declines is unknown, underscoring the need for establishing a more comprehensive monitoring and research program to study how factors like temperature, light, nutrients, turbidity, and chlorophyll a affect seagrass growth in the bay. While additional steps to reduce nutrient loading are clearly important for SAV recovery, additional information potentially directs additional steps needed to address the decline.
WETLANDS & RIPARIAN BUFFER
CCMP Priorities: Water Quality, Living Resources, Water Supply, Land Use
TARGET
Maintain or increase the current acreage of natural/vegetated upland buffers adjacent to all wetland and riparian corridors.
PROGRESS MADE
- Funding has been committed for updated mapping assessment of wetlands.
- Many areas for buffer enhancement have been identified.
INVESTMENT NEEDS
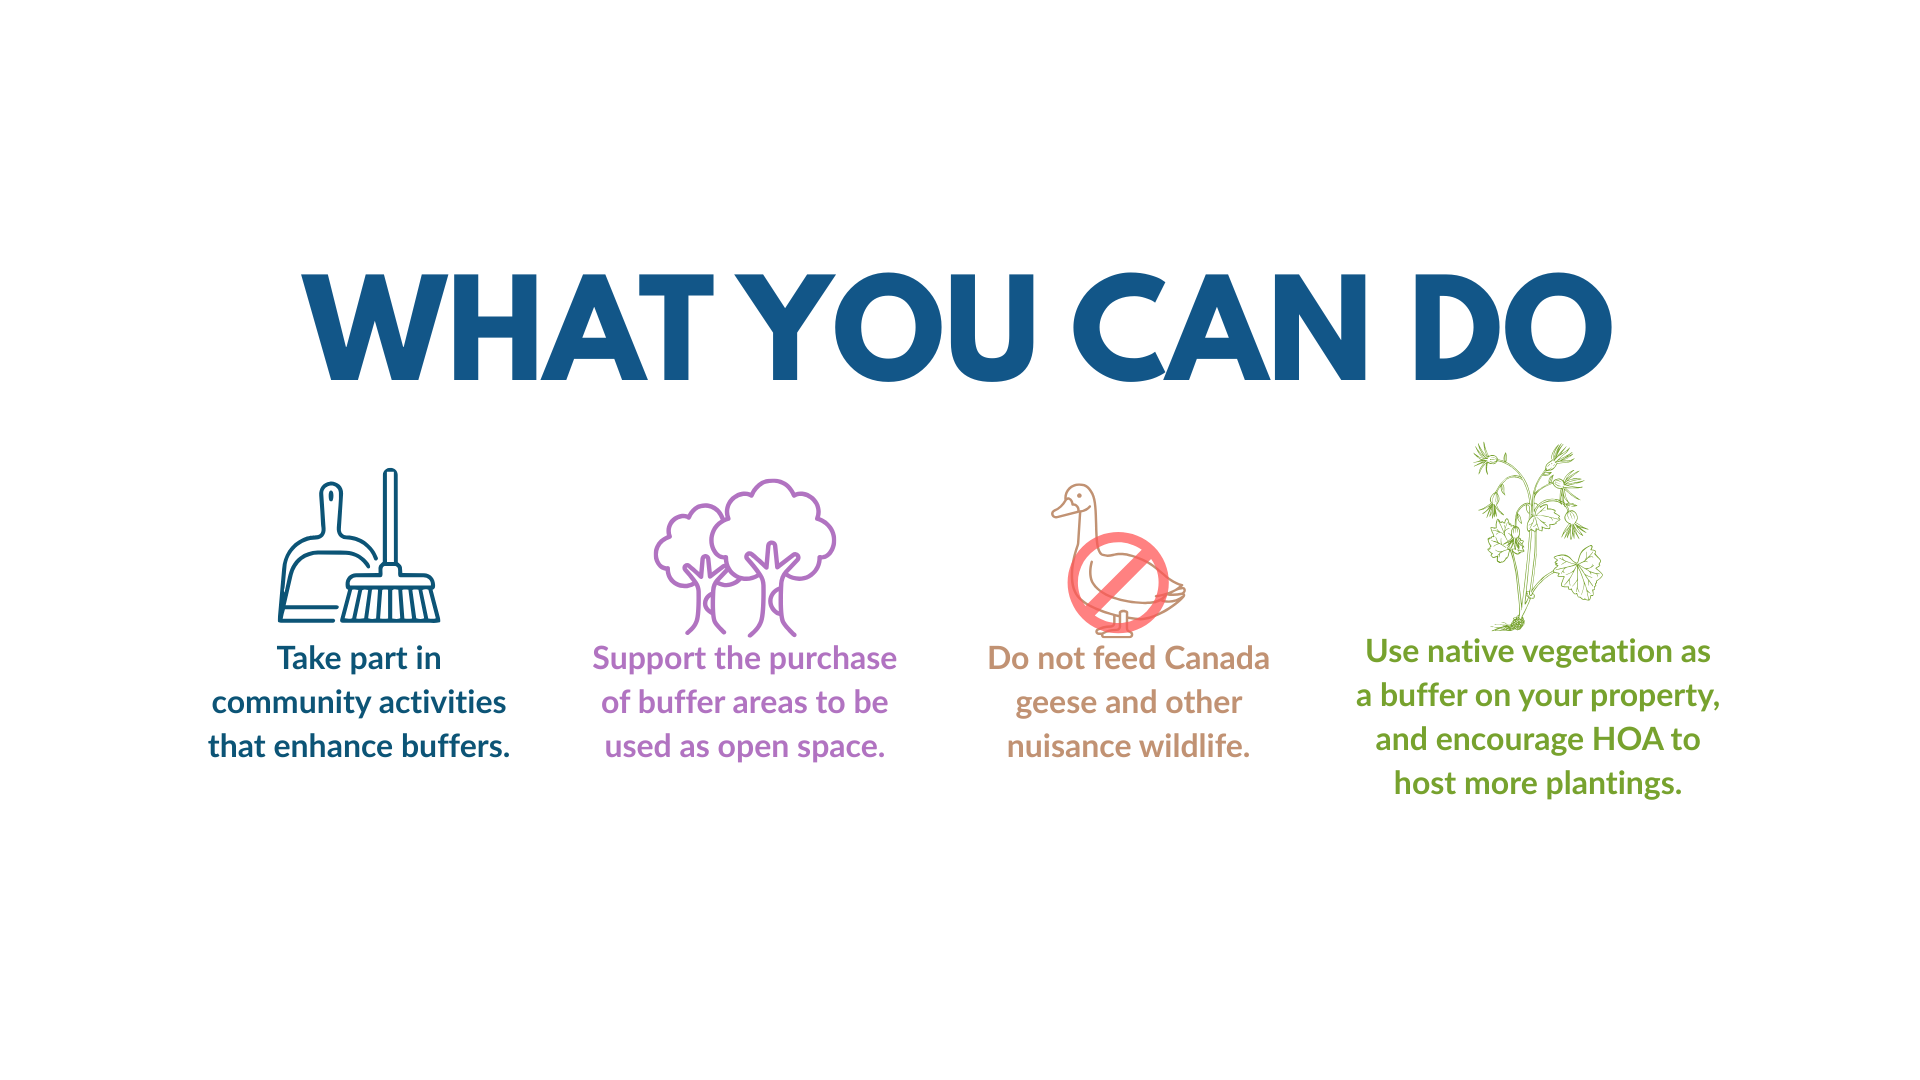
- Buffer enhancement (e.g., tree plantings, native plant borders) is essential on privately held lands.
- Private homeowners must be educated on responsible waterfront living practices.
BACKGROUND
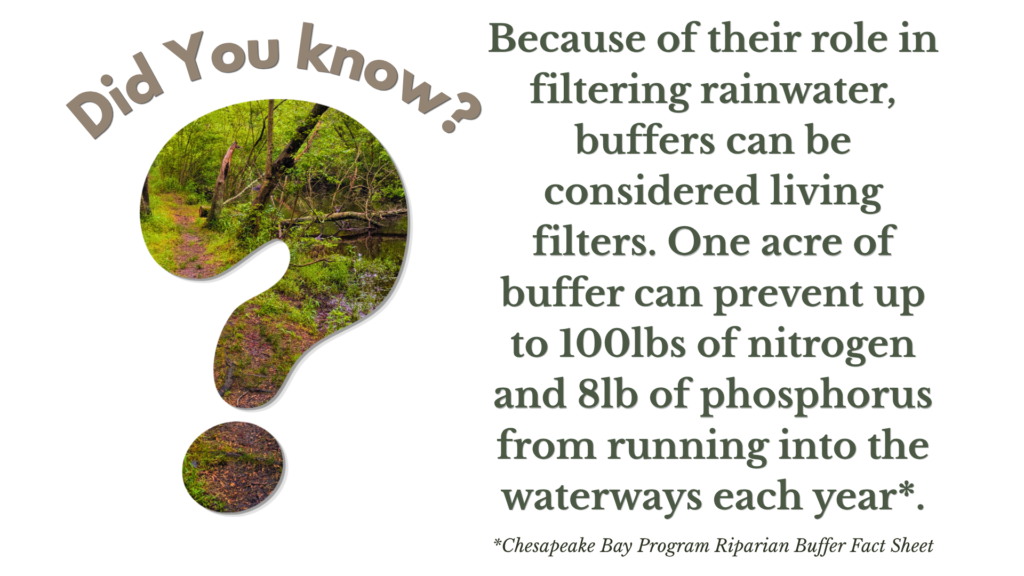
Riparian buffers are the terrestrial zones directly adjacent or hydrologically connected to streams, lakes, and rivers. Characterized by frequent flooding and moist soils, these areas play a critical role in intercepting nutrient pollution before it reaches the bay’s waterways. Healthy buffers feature uncompacted, undisturbed soils that allow rainfall to readily permeate the ground, supporting an abundance of native grasses, shrubs, and trees. This diverse vegetation forms a natural barrier that binds the shoreline, preventing banks from eroding or washing away. Above and below ground, the plants reduce flow velocities, trap sediments, anchor shorelines, and filter out excess nutrients to optimize water quality. During heavy storms, riparian zones absorb and slow rushing floodwaters, mitigating damage to nearby property. Furthermore, they provide essential forage, refuge, and nesting habitats for both aquatic and terrestrial wildlife, serving as vital movement corridors for resident and migratory species. Fallen leaves and insects from the canopy provide a foundational food source for aquatic life, while submerged branches and roots offer critical shelter for native fish.
primary indicator: Wetlands and Riparian Buffer
STATUS
The current status remains undetermined pending the completion of a comprehensive, watershed-wide digital mapping assessment.
TREND
Without historical or current comprehensive digital mapping data for these buffer zones, evaluating a long-term environmental trend is not yet possible.
KNOWLEDGE GAP
Buffers are critical to the health of the estuary. Recognizing this importance, the Barnegat Bay Partnership has allocated funding to map regional riparian zones and establish a comprehensive baseline. This spatial mapping effort will identify fragmented or inadequate buffer widths to target for ecological enhancement, such as community tree and shrub planting events. Currently, many residential areas throughout the watershed feature expansive mowed lawns directly adjacent to narrow or degraded buffers. These lawns offer prime opportunities for habitat expansion and restoration. Because many of these grassy areas are seldom utilized, homeowners could also realize significant long-term cost savings by replacing high-maintenance lawns with expanded natural buffers that eliminate the need for routine mowing.
WETLAND PROTECTION
CCMP Priorities: Water Quality, Living Resources, Water Supply, Land Use
TARGET
Maintain overall extent of tidal wetland acreage (20,922 acres) as identified on the 2015 aerial imagery. Restore or enhance 10 acres of tidal wetlands impacted by erosion through nature/natural based strategies to limit further loss.
PROGRESS MADE
- Funds for wetland mapping and restoration have been obtained.
- Planning and permitting for several large (>10 acre) restoration projects is underway.
INVESTMENT NEEDS
- Beneficial use of dredged materials for marsh restoration is increasingly necessary.
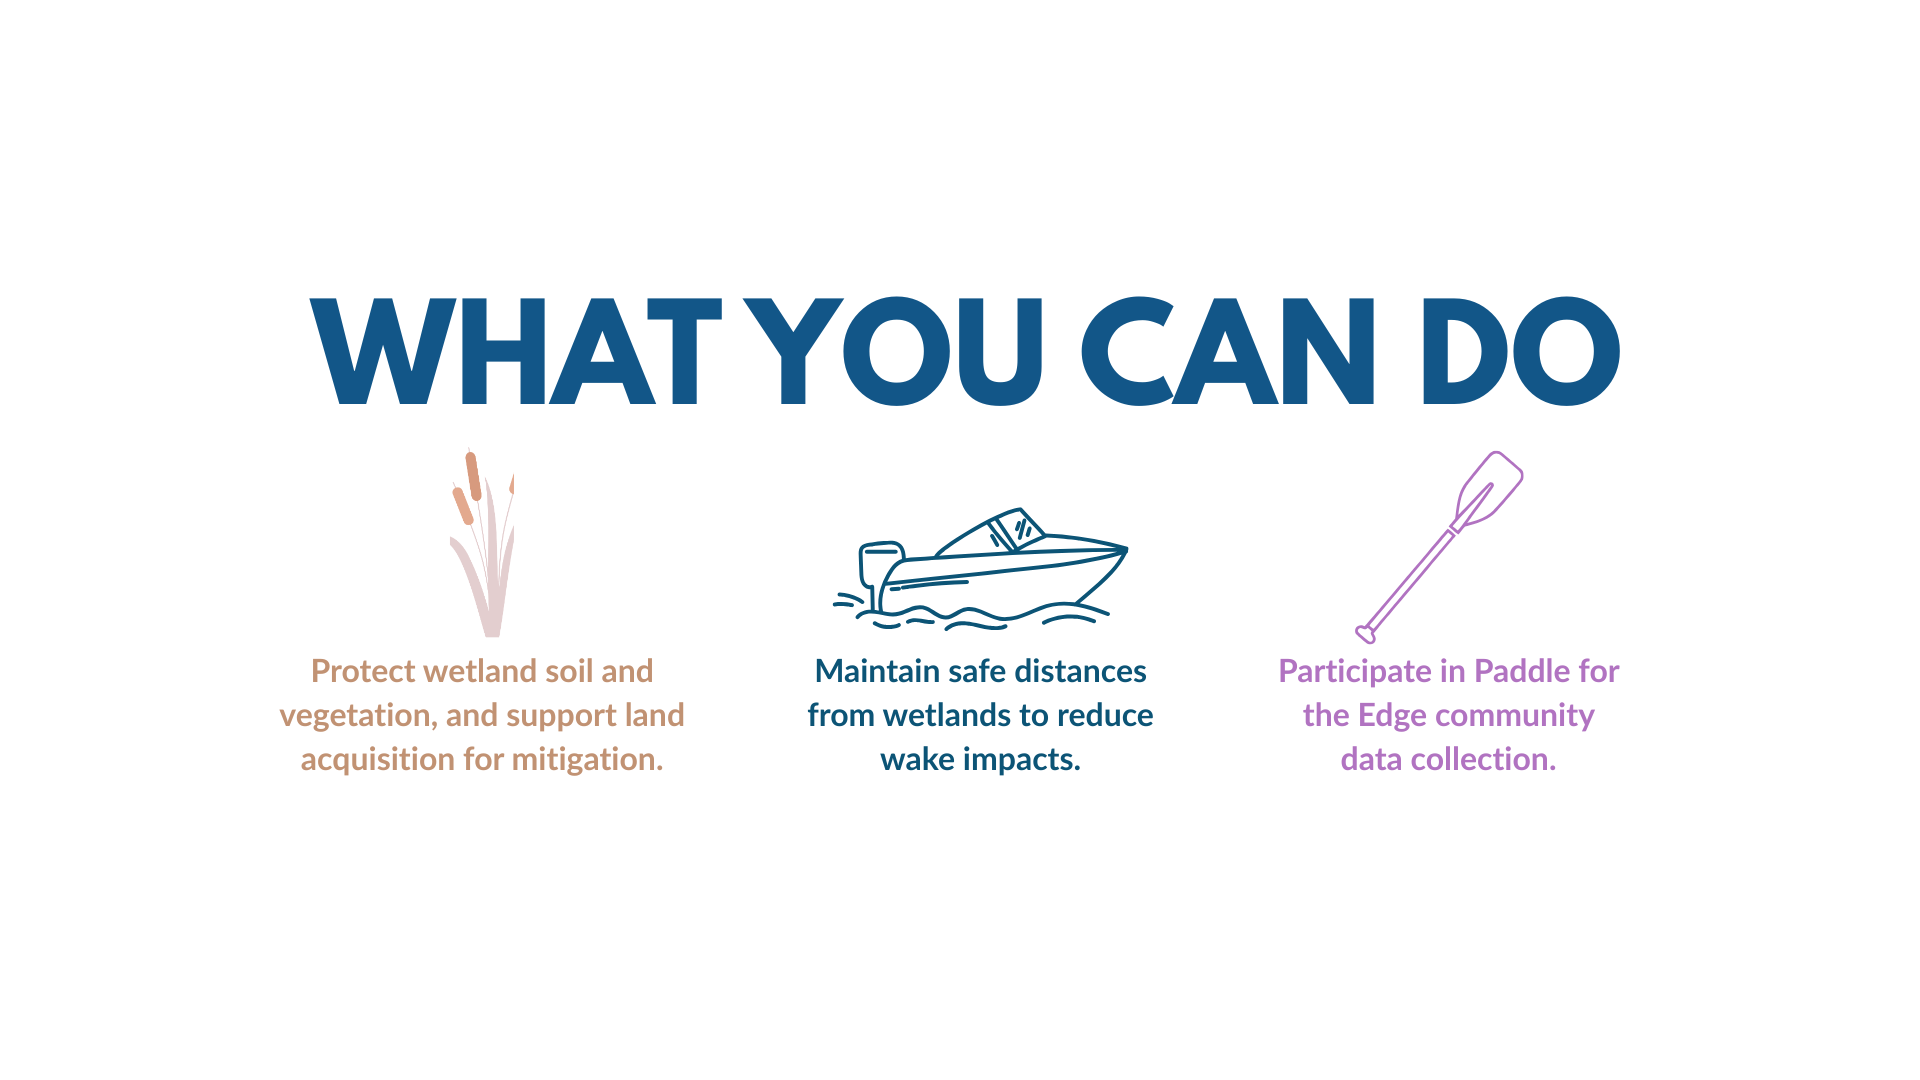
- More living shoreline projects are necessary to reduce erosion of wetland edges and protect ecosystem services.
BACKGROUND
The wetlands surrounding Barnegat Bay provide vital habitat for commercially, recreationally, and ecologically important fish, shellfish, and wildlife. These ecosystems also yield critical protective services, dampening wave energy and storm surges during extreme weather while slowing the advance of floodwaters. Furthermore, wetlands optimize water quality by trapping sediments, filtering pollutants, and processing excess nutrients. Unfortunately, many of these habitats are deteriorating, severely compromising their ecological value. Shoreline modifications, such as bulkheads and riprap, alter wave dynamics and accelerate marsh edge erosion. Simultaneously, rising water levels and historic mosquito ditching lower marsh platforms, stress native vegetation, and create stagnant pools of open water. Compounding these issues, ongoing coastal development restricts the natural corridors necessary for wetlands to migrate inland.
primary indicator: Wetland AREA
When last assessed in 2015, the Barnegat Bay watershed contained approximately 20,922 acres of tidal wetlands and 65,630 acres of freshwater wetlands. While no updated data has been collected since that baseline, dedicated funds have recently been secured to completely remap the region’s wetland systems over the next four years.
STATUS
The Stockton University Coastal Research Center completed the last comprehensive, bay-wide wetland survey in 2015. To update this baseline, the BBP and its regional partners are coordinating a new mapping initiative scheduled for completion within the next four years. Meanwhile, active habitat restoration remains underway across the watershed, including targeted projects within the Edwin B. Forsythe National Wildlife Refuge and on municipally owned marsh platforms, with additional stabilization efforts slated for the future.
TREND
Within the Barnegat Bay watershed, the total area of tidal wetlands decreased by approximately 2.7% between 1995 and 2015. Much of this loss stemmed from natural physical disruptions, such as edge erosion and wash-over events that buried marshes under sand. Concurrently, the extent of freshwater wetlands declined by roughly 2.2%, a loss primarily attributed to human alterations for residential and commercial development. While no updated mapping data has been collected since this period, these historical baselines underscore the dual threat of environmental and anthropogenic pressures on the watershed.
secondary indicator: Wetland RESTORATION
STATUS
Since 2020, the U.S. Fish and Wildlife Service has restored 13 acres of salt marsh, successfully surpassing its initial 10-acre target. Looking forward, the Partnership plans to rehabilitate an additional 10 acres over the next several years at a marsh site in Point Pleasant. Complementing these regional efforts, several local municipalities and conservation groups are actively engaging in localized wetland restoration projects.
TREND
While long-term dataset monitoring for these restoration efforts is currently limited, regional momentum and strategic planning continue to grow. Multiple initiatives are taking shape within the Edwin B. Forsythe National Wildlife Refuge and along the western shores of the bay to ensure the long-term resilience of these vital habitats.
CLAM RESTORATION
CCMP Priorities: Water Quality, Living Resources, Water Supply, Land Use
TARGET
Maintain flow levels at least 30% over minimum ecological flows for gauged waterways within the watershed.
PROGRESS MADE
- Millions of clams have been planted in recent years.
- ReClam the Bay has established an effective volunteer base.
- A Hard Clam Management Plan is in development to guide the stock’s continued recovery.
INVESTMENT NEEDS
- Regular stock assessments are vital to inform long-term clam management.
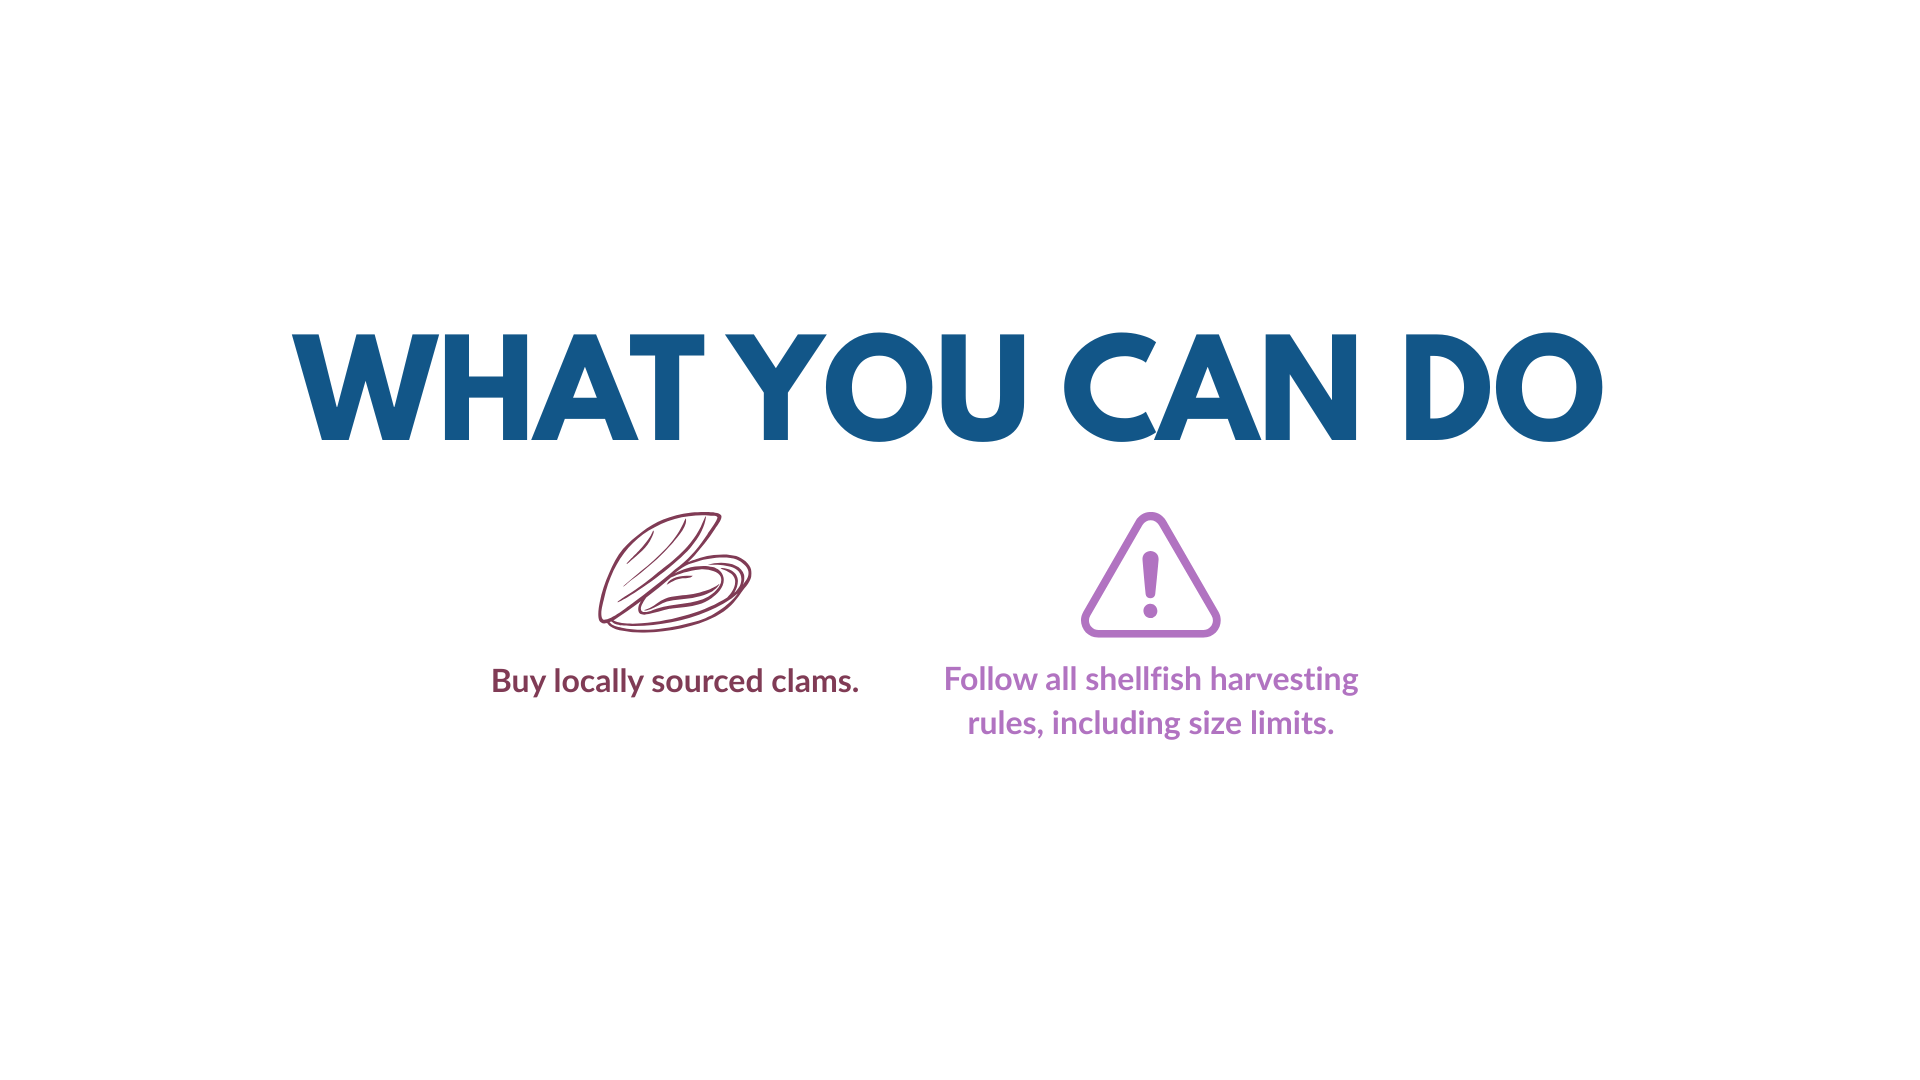
- Increased hard clam planting and assessment efforts are needed to improve survival and reproduction potential.
BACKGROUND
Hard clams are a commercially and recreationally important species that supports a valuable fishery. Because they are sensitive to shifts in water quality, they serve as an excellent indicator of the bay’s overall health. Within Barnegat Bay, the majority of the wild harvest is now recreational, while commercial operations have transitioned primarily to aquaculture. At the peak of the bay’s commercial fishery in 1879, clammers harvested an unprecedented 150,000 bushels of clams.
primary indicator: HARD CLAM ABUNDANCE
STATUS
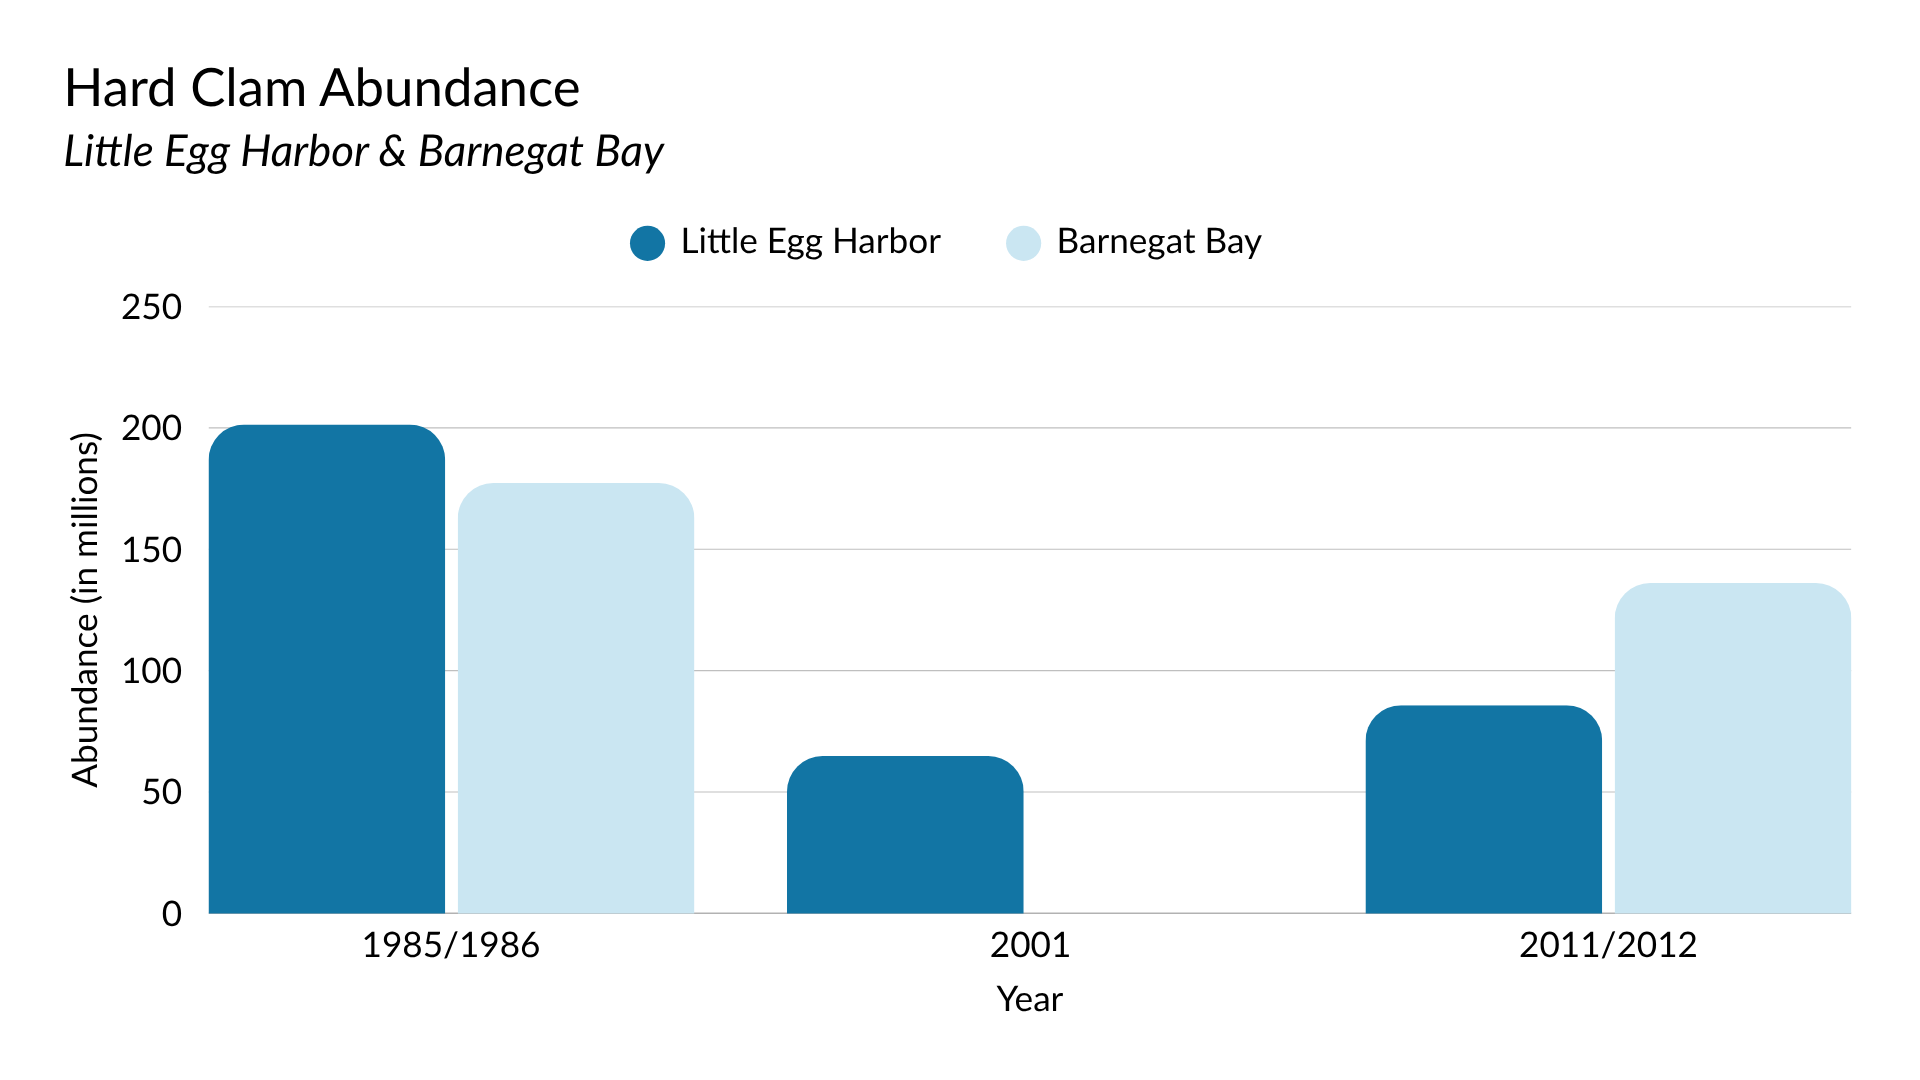
The last comprehensive, bay-wide stock assessment of hard clams was conducted in Little Egg Harbor (2011) and Barnegat Bay (2012), estimating a total standing stock of approximately 224 million clams (Figure 10). Because no regional population surveys have been executed since that period, the current abundance remains unknown.
Since 2006, the NJDEP and dedicated partners like ReClam the Bay have planted more than 7.5 million clams into the estuary (Figure 9). While their exact long-term survival rate is undocumented, most seeding has occurred within the highly accessible, approved waters of the Sedge Island Marine Conservation Zone; consequently, field managers assume a significant portion is harvested by recreational clammers or lost to natural predation.
TREND
With only two comprehensive, bay-wide surveys completed over the past 40 years, the existing dataset lacks the mathematical frequency required to determine a definitive long-term population trend.
KNOWLEDGE GAPS
Without regularly scheduled, bay-wide surveys, tracking the ongoing status and population trends of hard clams remains impossible. Furthermore, there is a total absence of data regarding wild harvests (both commercial and recreational) and incomplete documentation on cultured clam yields. To bridge these information gaps, the NJDEP is drafting a comprehensive Hard Clam Fishery Management Plan. This initiative aims to establish a framework of management and enhancement strategies to support long-term resource sustainability. Once finalized, the plan will provide the vital scientific data necessary to guide informed regulatory decisions and ensure the species’ recovery. In the interim, the NJDEP and partners like ReClam the Bay will continue their annual planting efforts to supplement local stocks.
Total Clams Planted Per Year
ECOLOGICAL FLOWS
CCMP Priorities: Water Quality, Living Resources, Water Supply, Land Use
TARGET
Maintain flow levels at least 30% over minimum ecological flows for gauged waterways within the watershed.
PROGRESS MADE
- Phase One of establishing an ecological low-flow threshold has been completed.
- Funding for future phases (II and III) necessary for establishing a low-flow theshold has been obtained.
INVESTMENT NEEDS
- Improved knowledge of groundwater withdrawals is needed.
- Changing conditions emphasize the need for improved water conservation.
primary indicator: stream flow
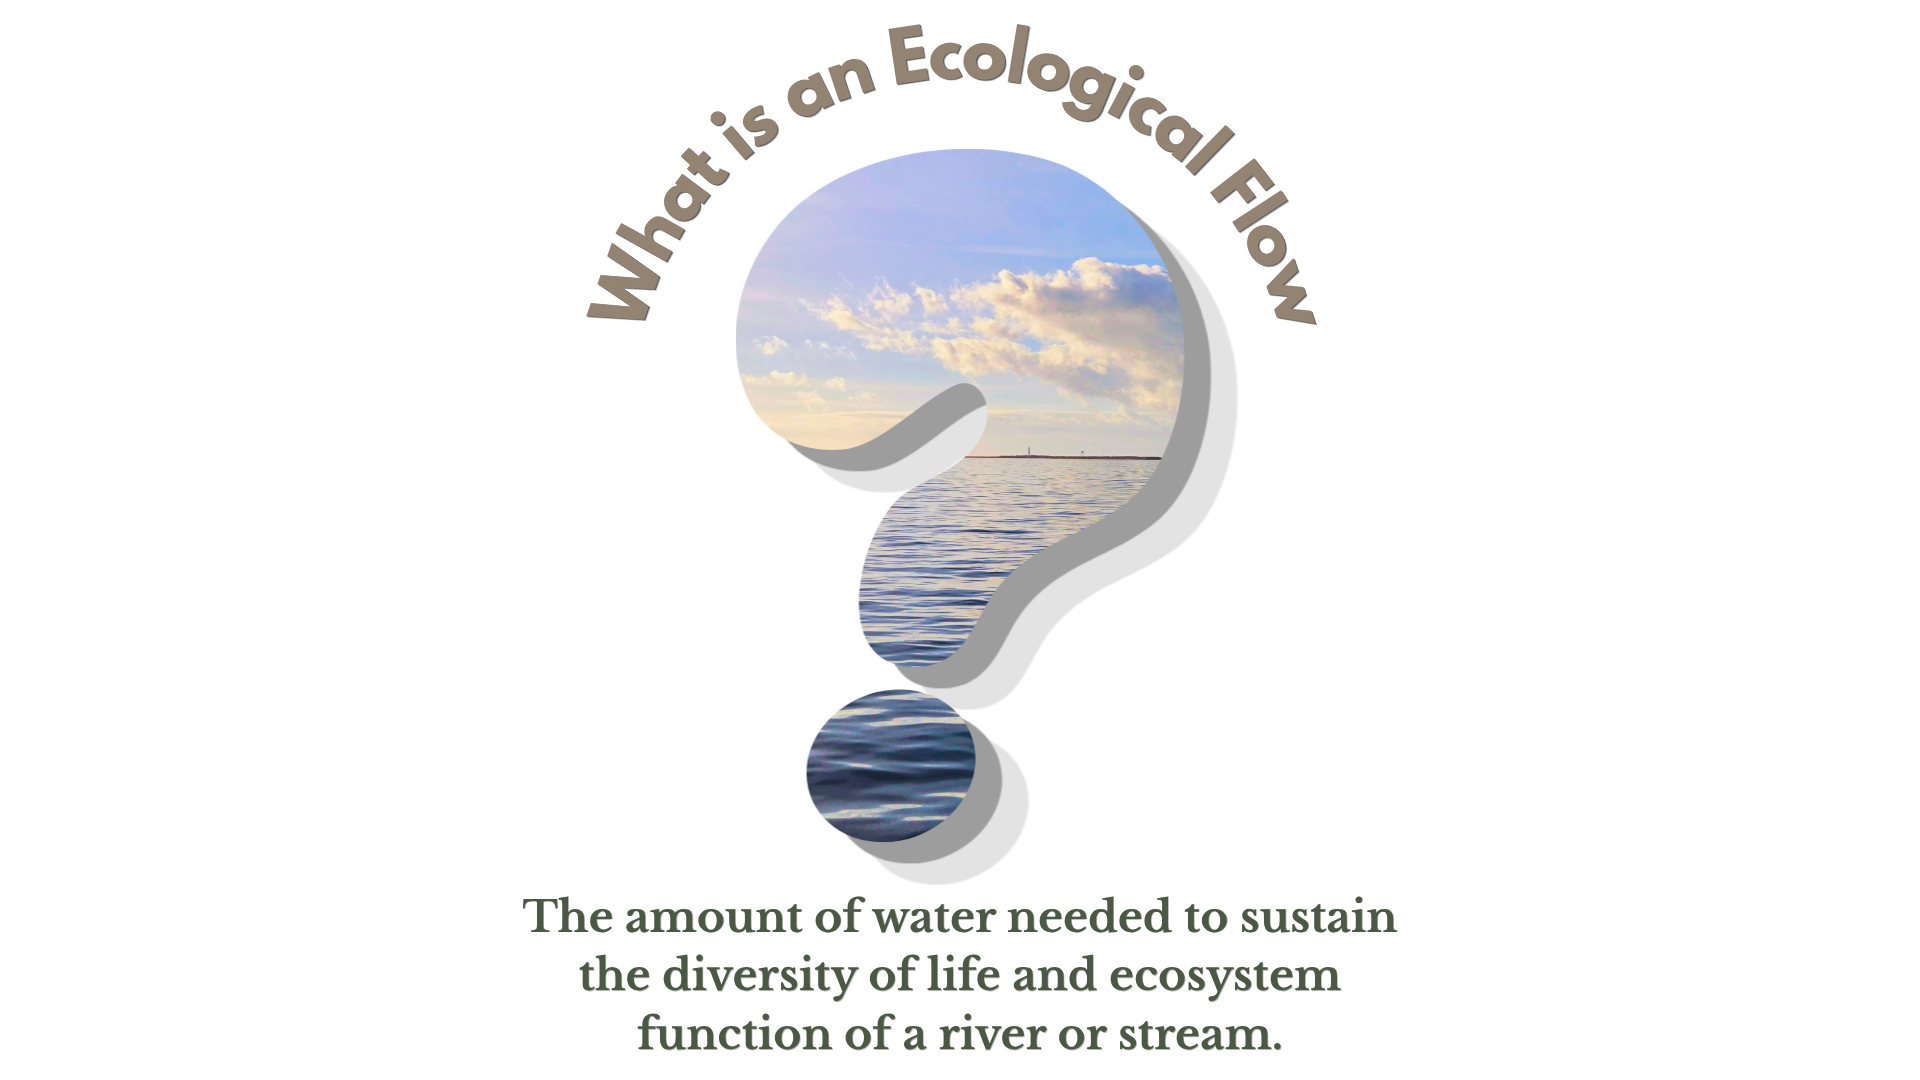
To track these dynamics, the U.S. Geological Survey (USGS) maintains a network of stream gauging stations that continuously monitor flow rates across the watershed’s major tributaries, including Cedar Creek, Toms River, Westecunk Creek, and the North Branch of the Metedeconk River.
STATUS
Currently, no minimum ecological flow criteria have been established to evaluate streamflow trends. However, available monitoring data from water year 2024 reveals that steady base flow accounted for 72% to 96% of total discharge across the watershed’s monitored waterways. Westecunk Creek exhibited the highest proportion of base flow (96%), followed closely by Cedar Creek (93%), Toms River (85%), and the North Branch of the Metedeconk River (72%). This spatial variation directly aligns with local land-use patterns, as groundwater-driven base flow consistently constitutes a higher percentage of the total water budget in less developed, less urbanized subwatersheds.
TREND
Assessing long-term streamflow trends remains challenging due to the current lack of established minimum ecological flow criteria. While monitoring records from 2004 through 2024 reveal a high degree of year-to-year variability in base flow, no uniform, watershed-wide trend is evident across all four streams. Looking at a broader historical window, however, a distinct shift emerges: over the last 52 years, the percentage of total flow sustained by base flow has significantly declined in both Toms River and the North Branch of the Metedeconk River—the two most heavily urbanized subwatersheds in the basin.
KNOWLEDGE GAPS
There are currently no minimum ecological flows established for the gauged waterways in the Barnegat Bay watershed. Without these criteria, it is not possible to determine whether flow goals are being met.
Although no minimum ecological flows have been set for streams in the watershed, the US Geological Survey completed a 2025 study comparing streamflow statistics from two historical periods (1933–1988) with a recent period (2004–2020) for four major streams (Figure 11). The study analyzed monthly, seasonal, and annual low-flow patterns, streamflow trends, and land-use changes to better understand watershed flow conditions. This work provides a foundation for developing ecological flow targets in the Barnegat Bay watershed.
BACKGROUND
Approximately 590 million gallons of freshwater discharge into Barnegat Bay daily via more than 15 rivers, streams, and creeks. This freshwater input consists of two primary components: base flow and surface runoff. Base flow originates chiefly from groundwater, providing a stable, continuous supply.
Conversely, runoff occurs intermittently when rainfall or irrigation sweeps across the landscape and drains into tributaries—a process accelerated during storms, particularly within developed areas. In pristine, undeveloped landscapes, runoff constitutes only a fraction of total streamflow. However, as urbanization expands, impervious surfaces multiply, significantly increasing the proportion of stormwater runoff. This shift diminishes groundwater recharge, and the resulting reduction in base flow can degrade water quality and destabilize aquatic habitats, impacting both ecological communities and local populations.
Percent of Total Base Flow per Water Body
WATER CONSERVATION & REUSE
CCMP Priority: Water Supply
TARGET
Reduce five-year rolling average water withdrawals to 10% below the 2010 estimate of 85.56 million gallons per day (MGD).
PROGRESS MADE
- Per capita water usage has declined as water-saving appliances and water-saving practices such as rain barrels and native plants have been effective.
INVESTMENT NEEDS
- We must further reduce per capita water use to offset coastal population growth.
- Water from small wells must be tracked.
- Increased water reuse efforts are necessary.
- We need new USGS estimates of withdrawals.
BACKGROUND
Humans depend on freshwater for drinking, agriculture, irrigation, and industrial processes. Similarly, adequate freshwater inputs are essential to support local wildlife, sustain native plant communities, and maintain the bay’s delicate chemical balance. When freshwater inflows decrease, salinity levels spike, altering local species distributions. Consequently, balancing the water needs of both society and the environment is critical. Excessive water consumption depletes local ecosystems and, when coupled with low rainfall or drought, poses severe threats to both human communities and the estuary. Prioritizing water conservation and recycling helps safeguard these vital resources for future generations.
Potable water which is safe for drinking, cooking, and cleaning comprises the largest portion of water used in Ocean County. After use, most of this supply is collected by sewer systems and piped to centralized treatment plants, where it is processed and subsequently discharged into the Atlantic Ocean.
Rather than treating this effluent as waste, numerous possibilities exist to implement and expand regional water reuse programs. Diverting treated wastewater for purposes that do not require drinking-quality water maximizes this finite resource. Practical examples include utilizing captured stormwater for landscape irrigation, repurposing industrial wash-water for street cleaning, cycling cooling water at utility plants, or routing greywater for toilet flushing. This loop conserves pristine groundwater reserves and slashes the energy footprint required to treat both potable water and wastewater.
Taking proactive steps in municipal water conservation, Brick Township recently installed an Aquifer Storage and Recovery (ASR) well. This specialized infrastructure injects treated water into underground aquifers during periods of excess supply (such as wet seasons) and recovers that same water to augment the public supply during peak summer demand or prolonged drought.
primary indicator: WITHDRAWALS
STATUS
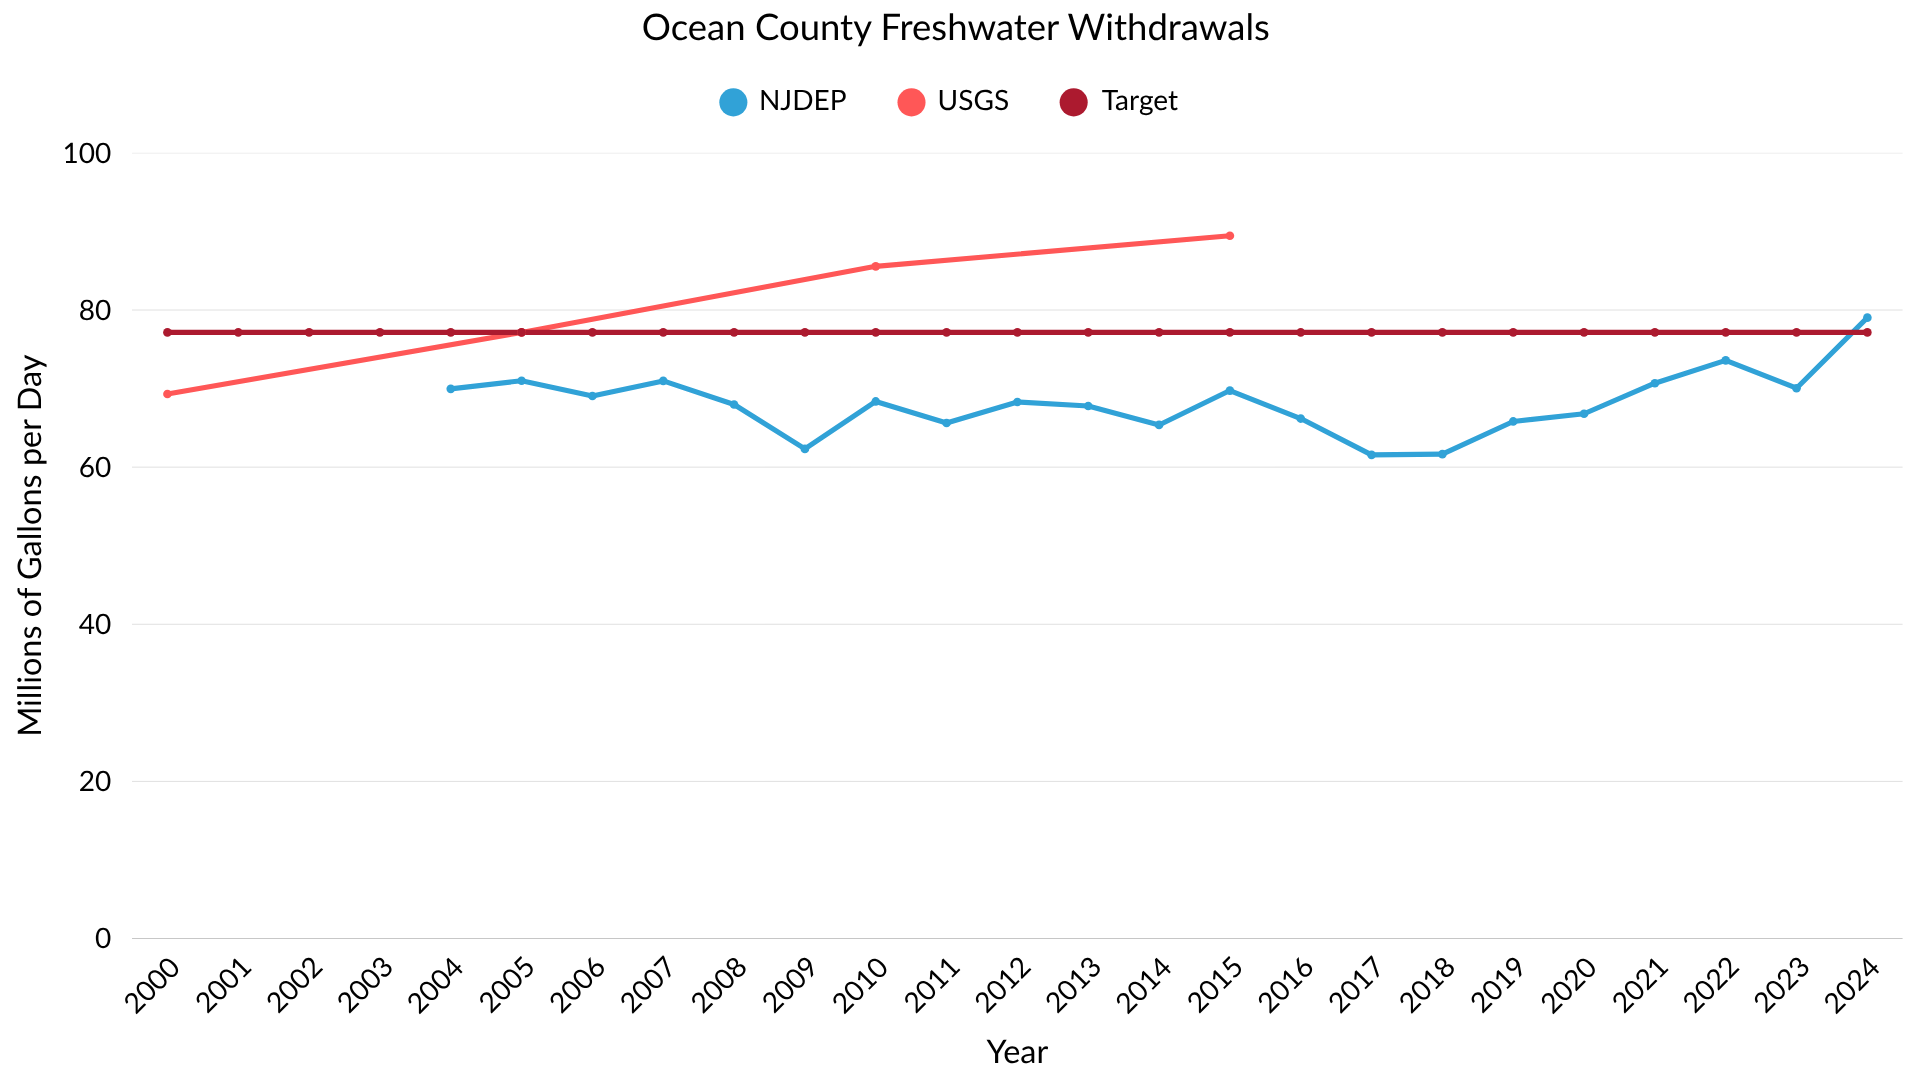
The most recent USGS assessment of water withdrawals in Ocean County occurred in 2015, estimating usage at 89.46 million gallons per day—approximately 12% above the baseline target, resulting in a status designation of “not achieving.”
Concurrently, the NJDEP tracks annual consumption by monitoring permitted extraction volumes. These metrics inherently underrepresent true water usage, as reporting is only mandatory for allocations exceeding 100,000 gallons per day. Furthermore, this dataset excludes water imported from Monmouth County to support developed communities in northern Ocean County. While the NJDEP recorded 68.36 million gallons per day in 2010, the five-year rolling average from 2020 through 2024 rose to 72.03 million gallons per day. Consequently, it is highly probable that total regional consumption remains above the 2010 management target (Figure 12).
TREND
While water withdrawals were expanding and driving a worsening trend when last evaluated in 2015, a lack of recent monitoring data leaves the current trajectory unknown. This prolonged absence of updated information constitutes an increasingly critical data gap.
Ocean County Wastewater Flow and Reclaimed Water
SECONDARY INDICATOR: WASTEWATER FLOW AND WATER REUSE DATA
STATUS
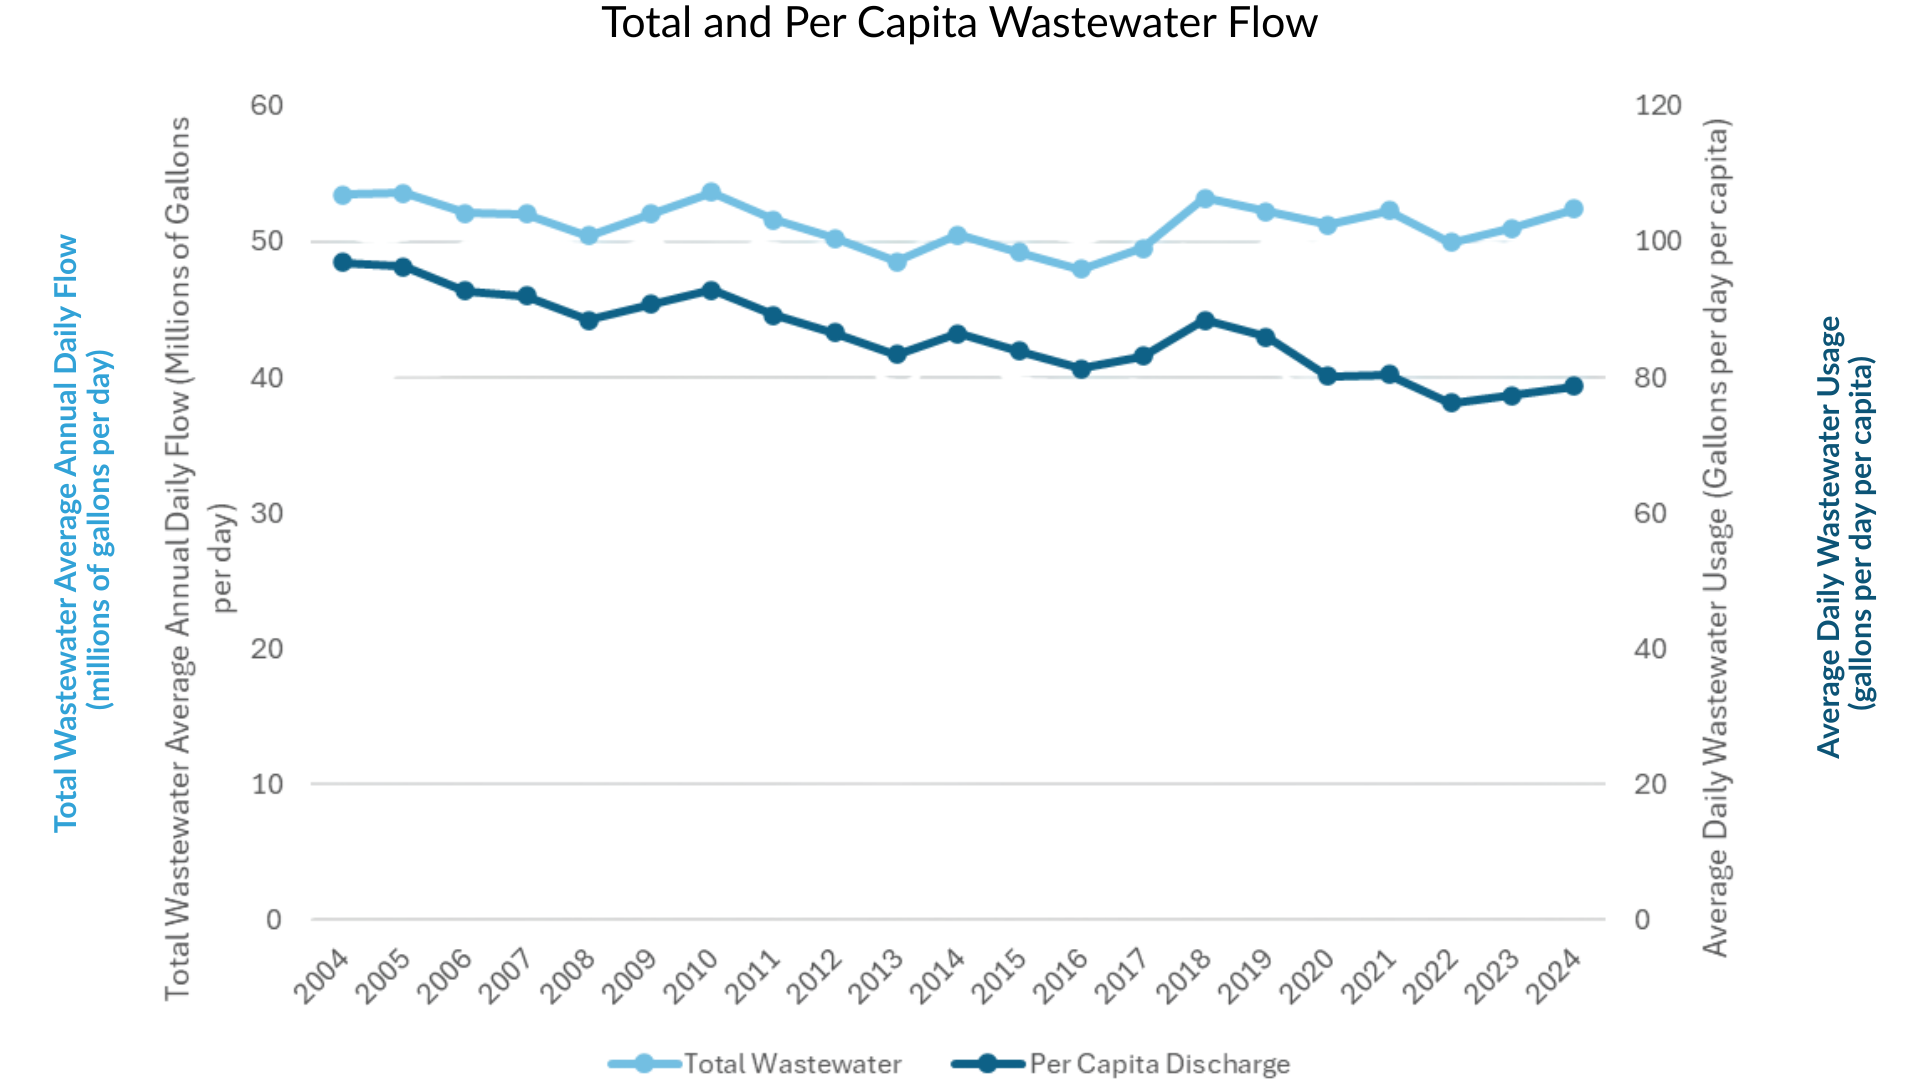
All wastewater from sewered areas in Ocean County is treated by the Ocean County Utilities Authority, which tracks treatment volumes over time. This does not include water used for personal, irrigation, or industrial purposes in unsewered areas (e.g., many communities in the Pinelands). There are approximately 22,500 septic systems which do not contribute to the tracked wastewater totals. From 2020 through 2024, per capita wastewater flow averaged 79 gallons per day (Figure 13).
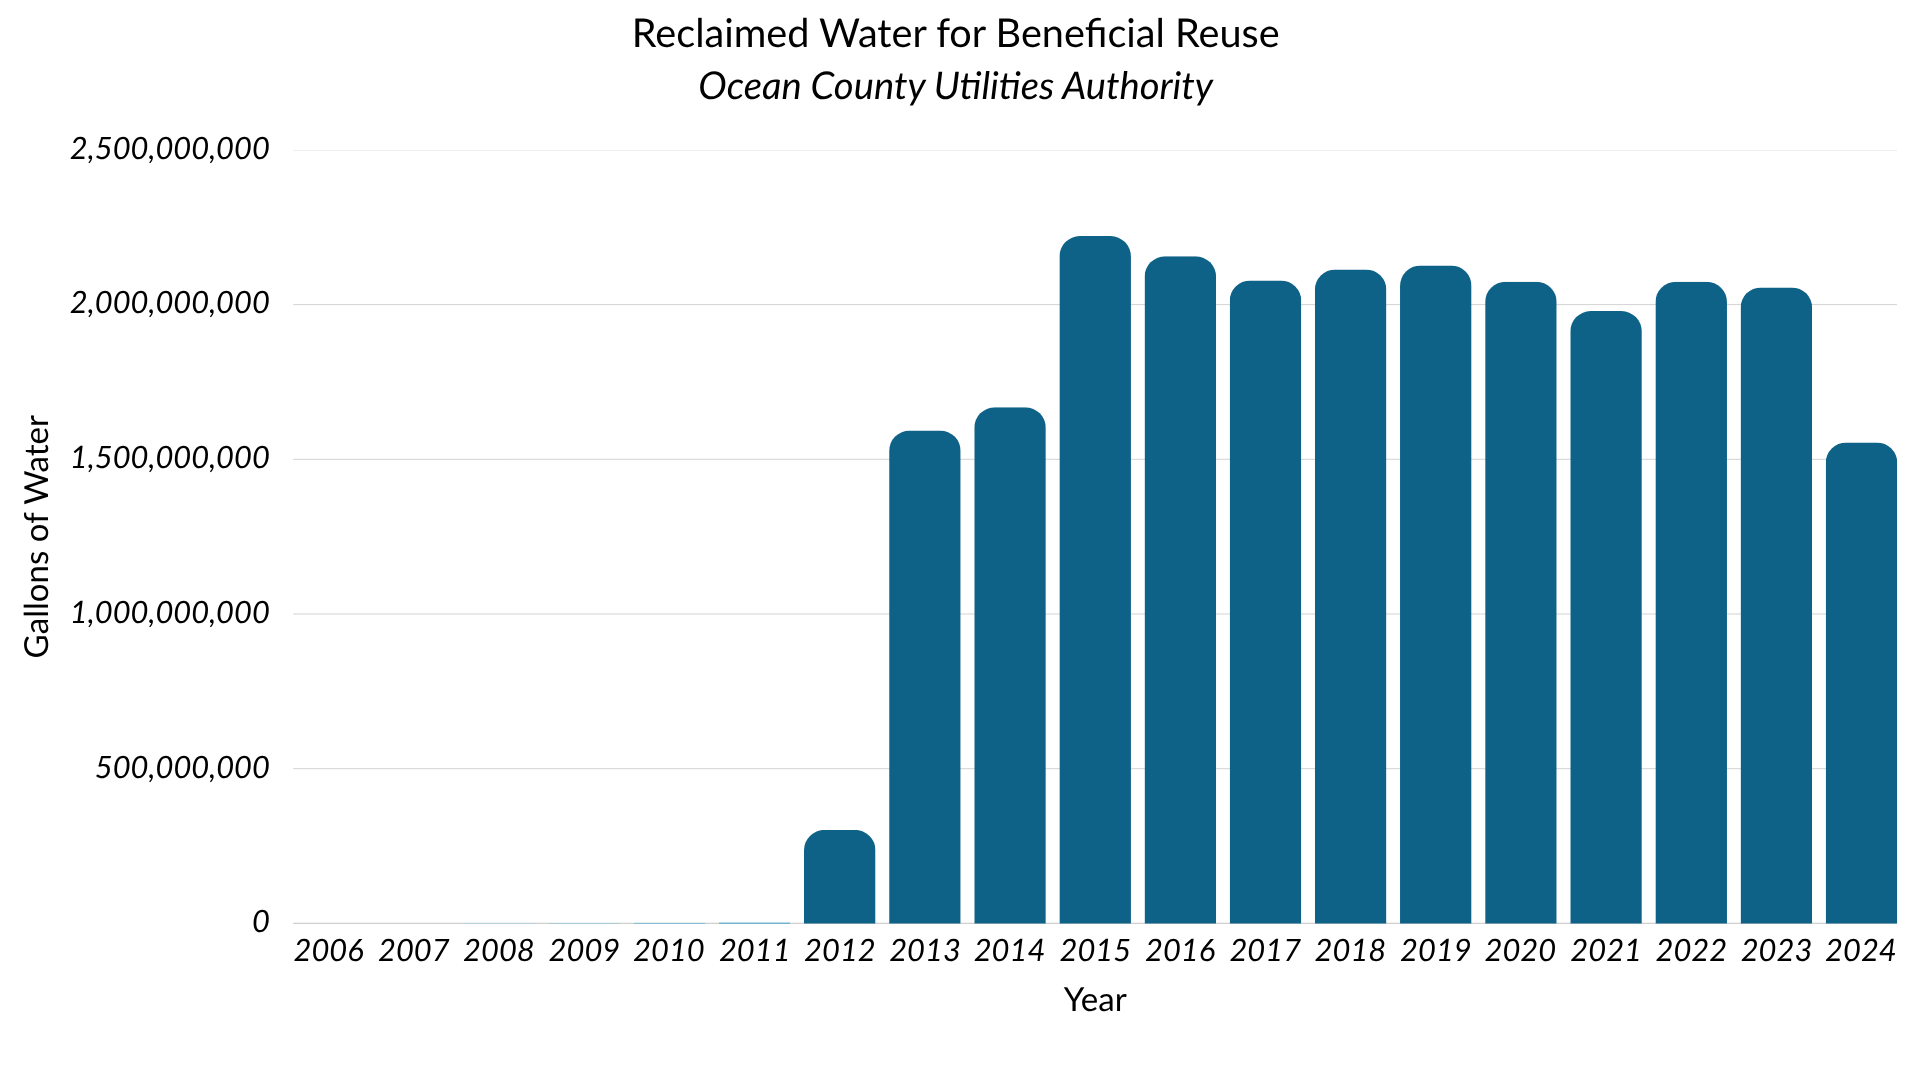
Water reuse efforts averaged about 1.9 billion gallons per year during 2020–2024, and have remained relatively steady since 2013 (Figure 14). In three of the last five years, reuse exceeded 2 billion gallons, supporting activities like fire protection, irrigation, and industrial processes.
TREND
Per capita wastewater has declined over the past 20 years, showing that water conservation measures, like installing water-saving appliances, have been effective. However, total wastewater flow has remained steady, as population growth has offset individual reductions.
The NJDEP 2017–2022 New Jersey Water Supply Plan projects that the state will have sufficient water if conservation and reuse continue. The plan estimates that an additional 3.4 million gallons per day or about 1.2 billion gallons per year, could be saved in the Barnegat Bay watershed through further conservation. Water reuse has been steady over the past decade.
KNOWLEDGE GAPS
Due to outside water being brought into Ocean County, and no reporting required for withdrawals less than 100,000 gallons per day, water withdrawals may not accurately reflect water use in Ocean County. Likewise, updates to the USGS estimates have not yet been completed, and the current estimates are outdated, with the last update ten years ago.
Water withdrawal data comes from NJDEP self-reports, and is estimated by USGS. Groundwater diversions below 100,000 gallons per day are not required to be reported to NJDEP, leading to an undercount of total groundwater diversions and a disparity between NJDEP’s and USGS’s figures for water use. It is important that these “small” groundwater diversions be monitored for accurate estimates of water withdrawal and infrastructure planning going forward.
While wastewater flow is a stable metric of domestic water use, it does not capture non-sewered areas, which are common throughout the watershed.
ENVIRONMENTAL CONDITIONS
Weather directly and indirectly affects human and natural communities in many ways. Air temperatures influence water temperatures, which affect many species’ extent and timing of movements, growth, reproduction, and physiology. Precipitation affects the movements of water and materials on and across the landscape, with adverse (e.g., nutrient runoff) and beneficial (e.g., groundwater recharge) consequences to the ecology of the bay. Changing water levels have important implications for the function of our marshes and our coastal communities. The following indicators highlight some of the changing conditions in the bay and its habitats.
AIR TEMPERATURES
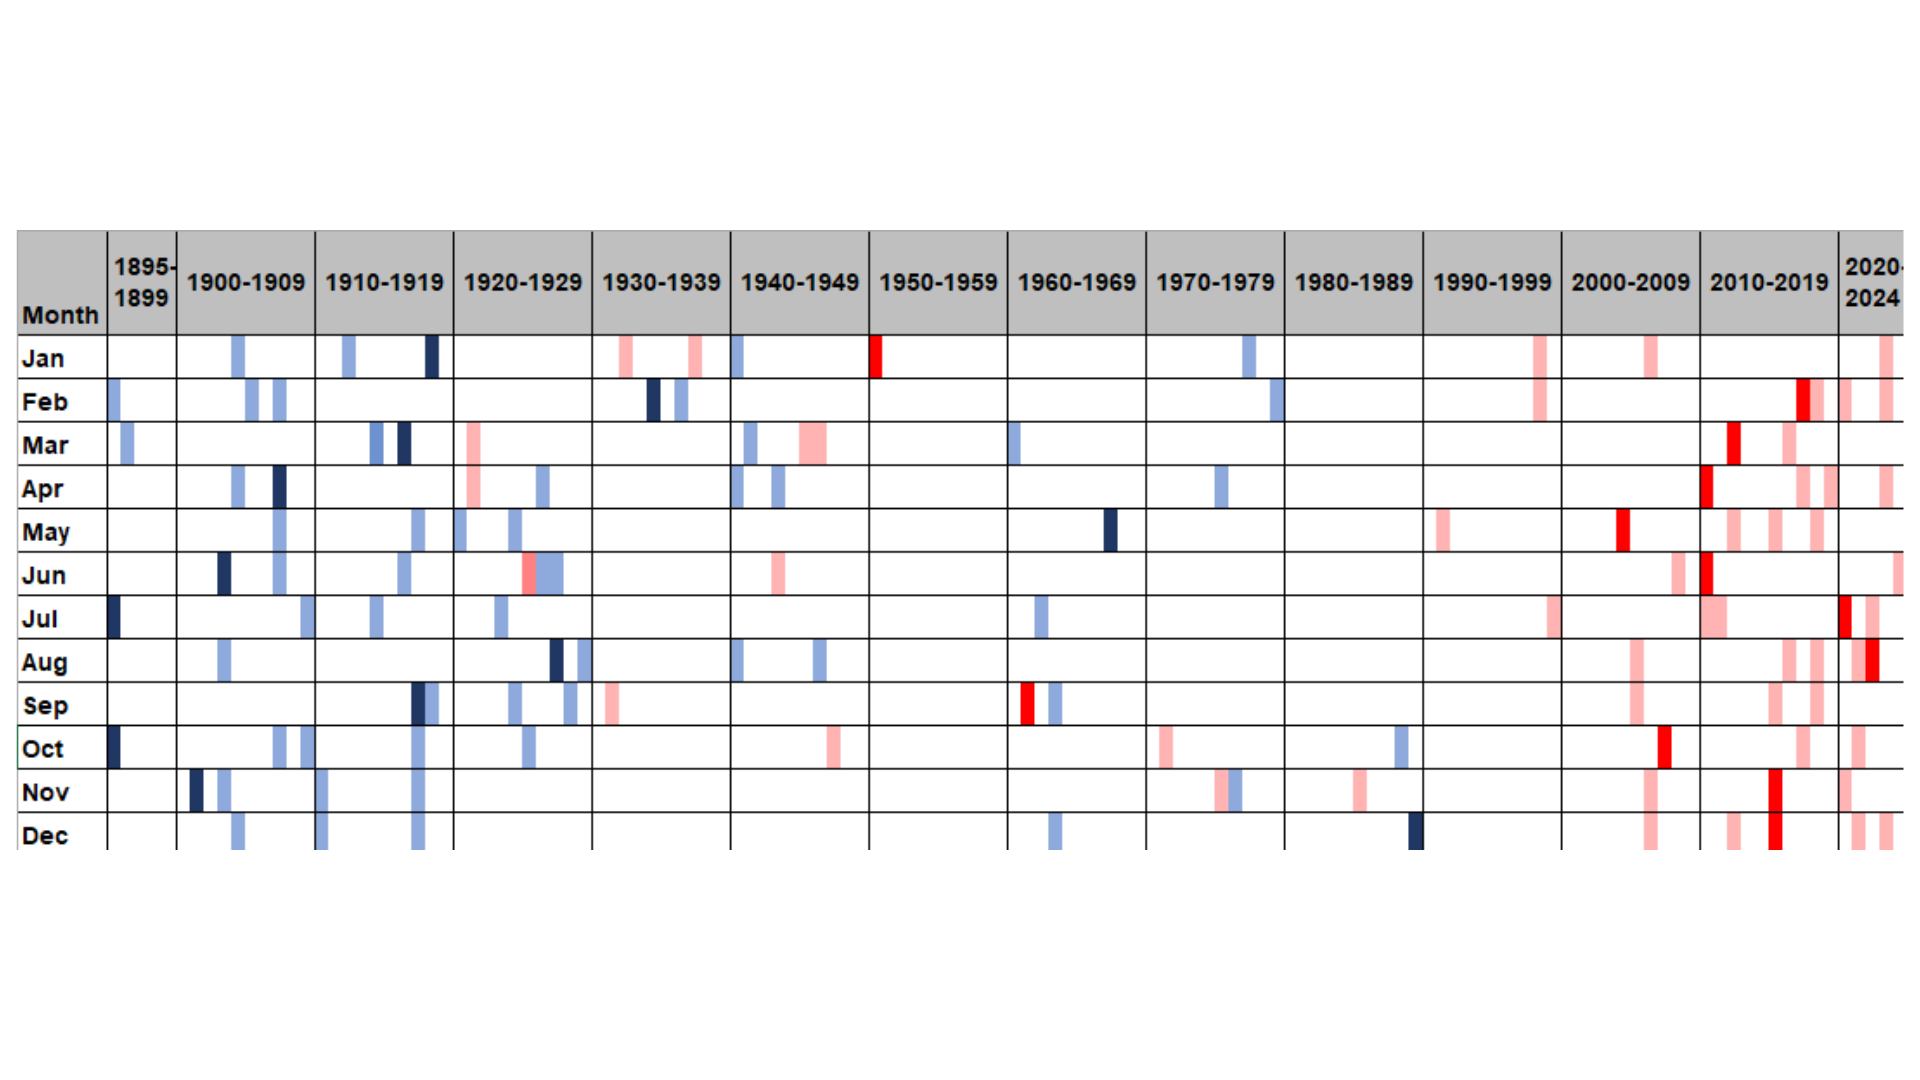
A review of more than 130 years of temperature data from Ocean County reveals that over two-thirds of the warmest months on record have occurred within the past three decades—a disproportionate concentration given that this period represents only 23% of the historical record. Remarkably, since 2000, ten out of twelve months (February through August, alongside October, November, and December) have experienced their absolute warmest individual months on record (Figure 15). Conversely, no historically cold month has been registered since 1989. These compounding thermal shifts are actively altering both terrestrial and aquatic ecosystems, including the delicate habitats of the bay.
Rising air temperatures significantly alter ecological distributions, creating welcoming environments for southern species to migrate northward while displacing cold-adapted native species further north. This shift can accelerate the spread of invasive species and destabilize local communities, causing once-abundant native organisms to become increasingly rare over time.
PRECIPITATION
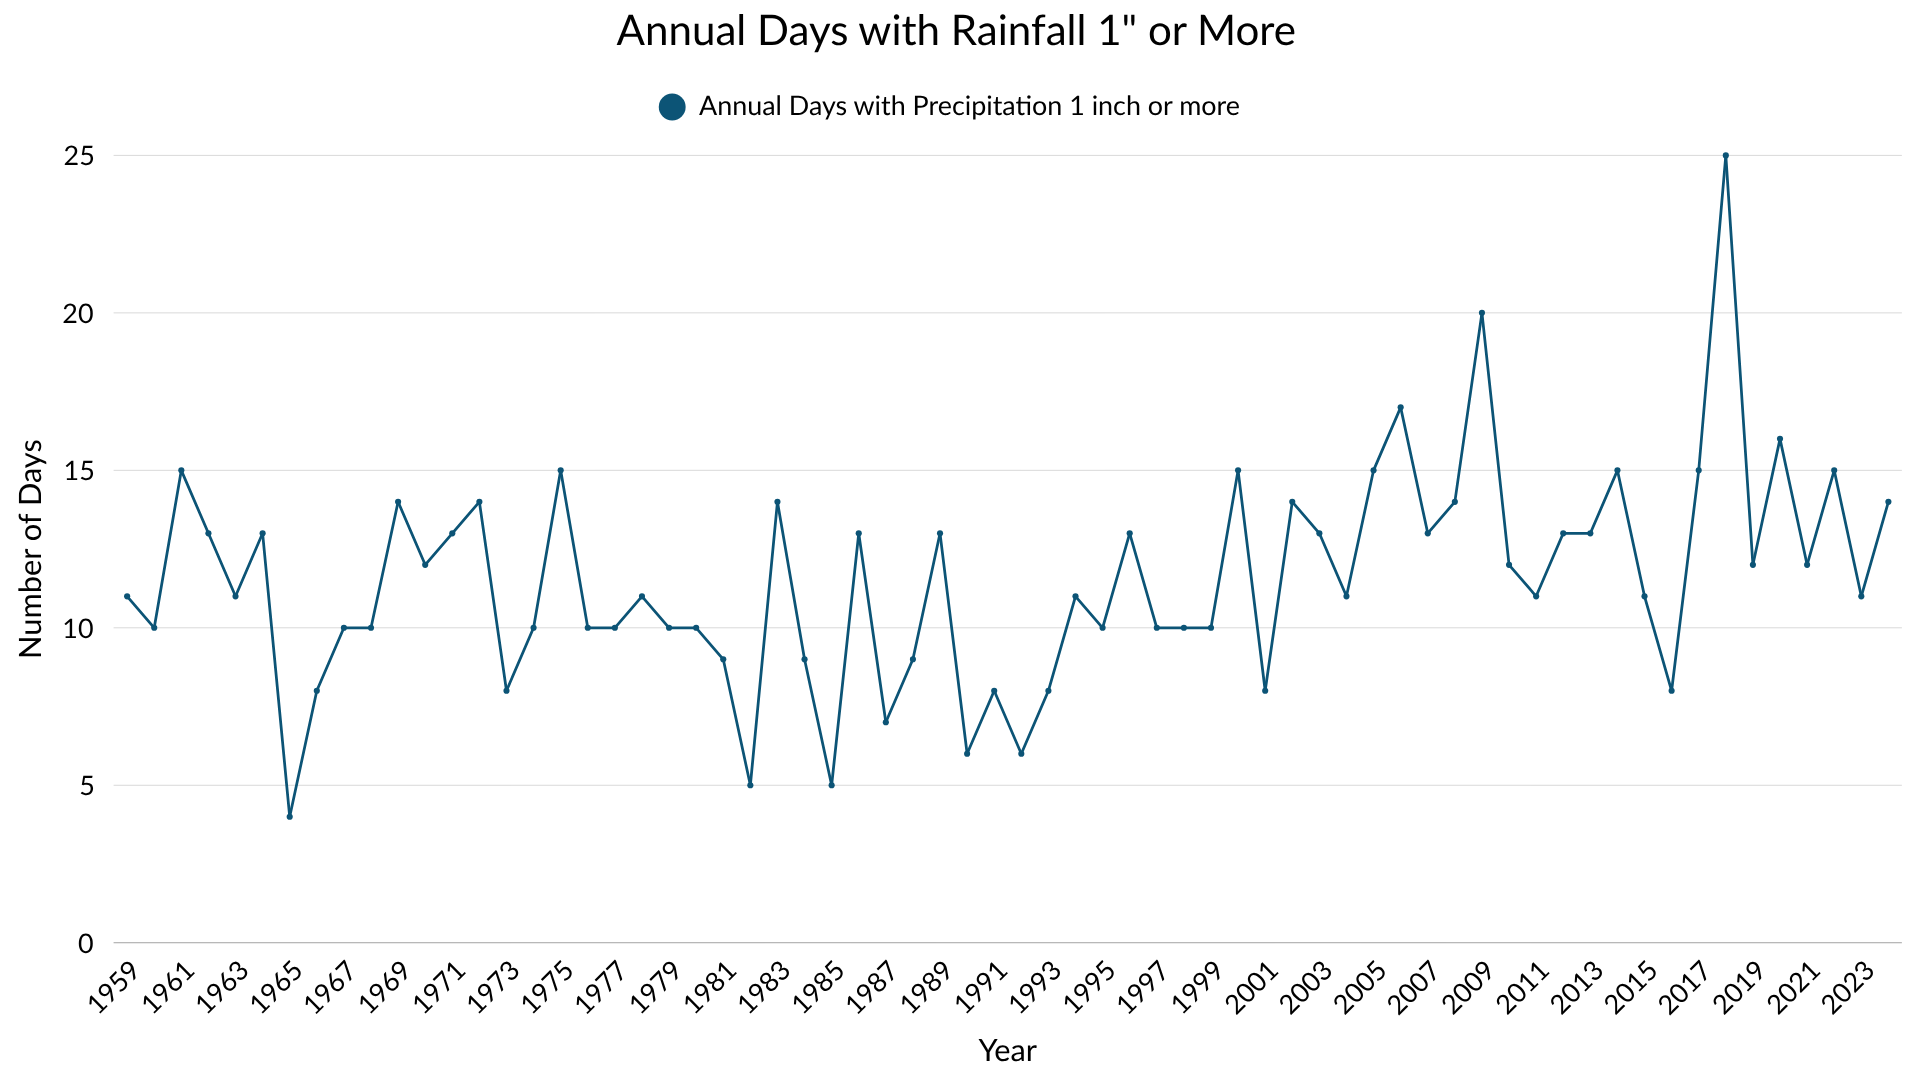
Rainfall patterns across the watershed dictate nutrient loading, debris pollution, groundwater recharge, streamflow, and localized flooding—dynamic shifts that profoundly impact both human and ecological communities. Heavy precipitation events have grown increasingly frequent, evidenced by a significant long-term rise in the number of days receiving an inch or more of rain (Figure 16). When intense downpours are superimposed on rapid coastal development and expanding impervious cover, they generate severe stormwater surges, presenting worsening and chronic flooding challenges for many coastal municipalities.
Expanding precipitation across an increasingly developed, impervious landscape accelerates the delivery of nutrient pollution to the bay via stormwater runoff. This trend significantly escalates both the structural necessity and financial cost of regional stormwater management. Paradoxically, despite the rise in severe downpours, Ocean County has also recently endured prolonged periods of drought. This duality underscores the highly volatile, episodic nature of modern weather patterns, demonstrating that short-term localized conditions may not mirror long-term trends.
sea levels
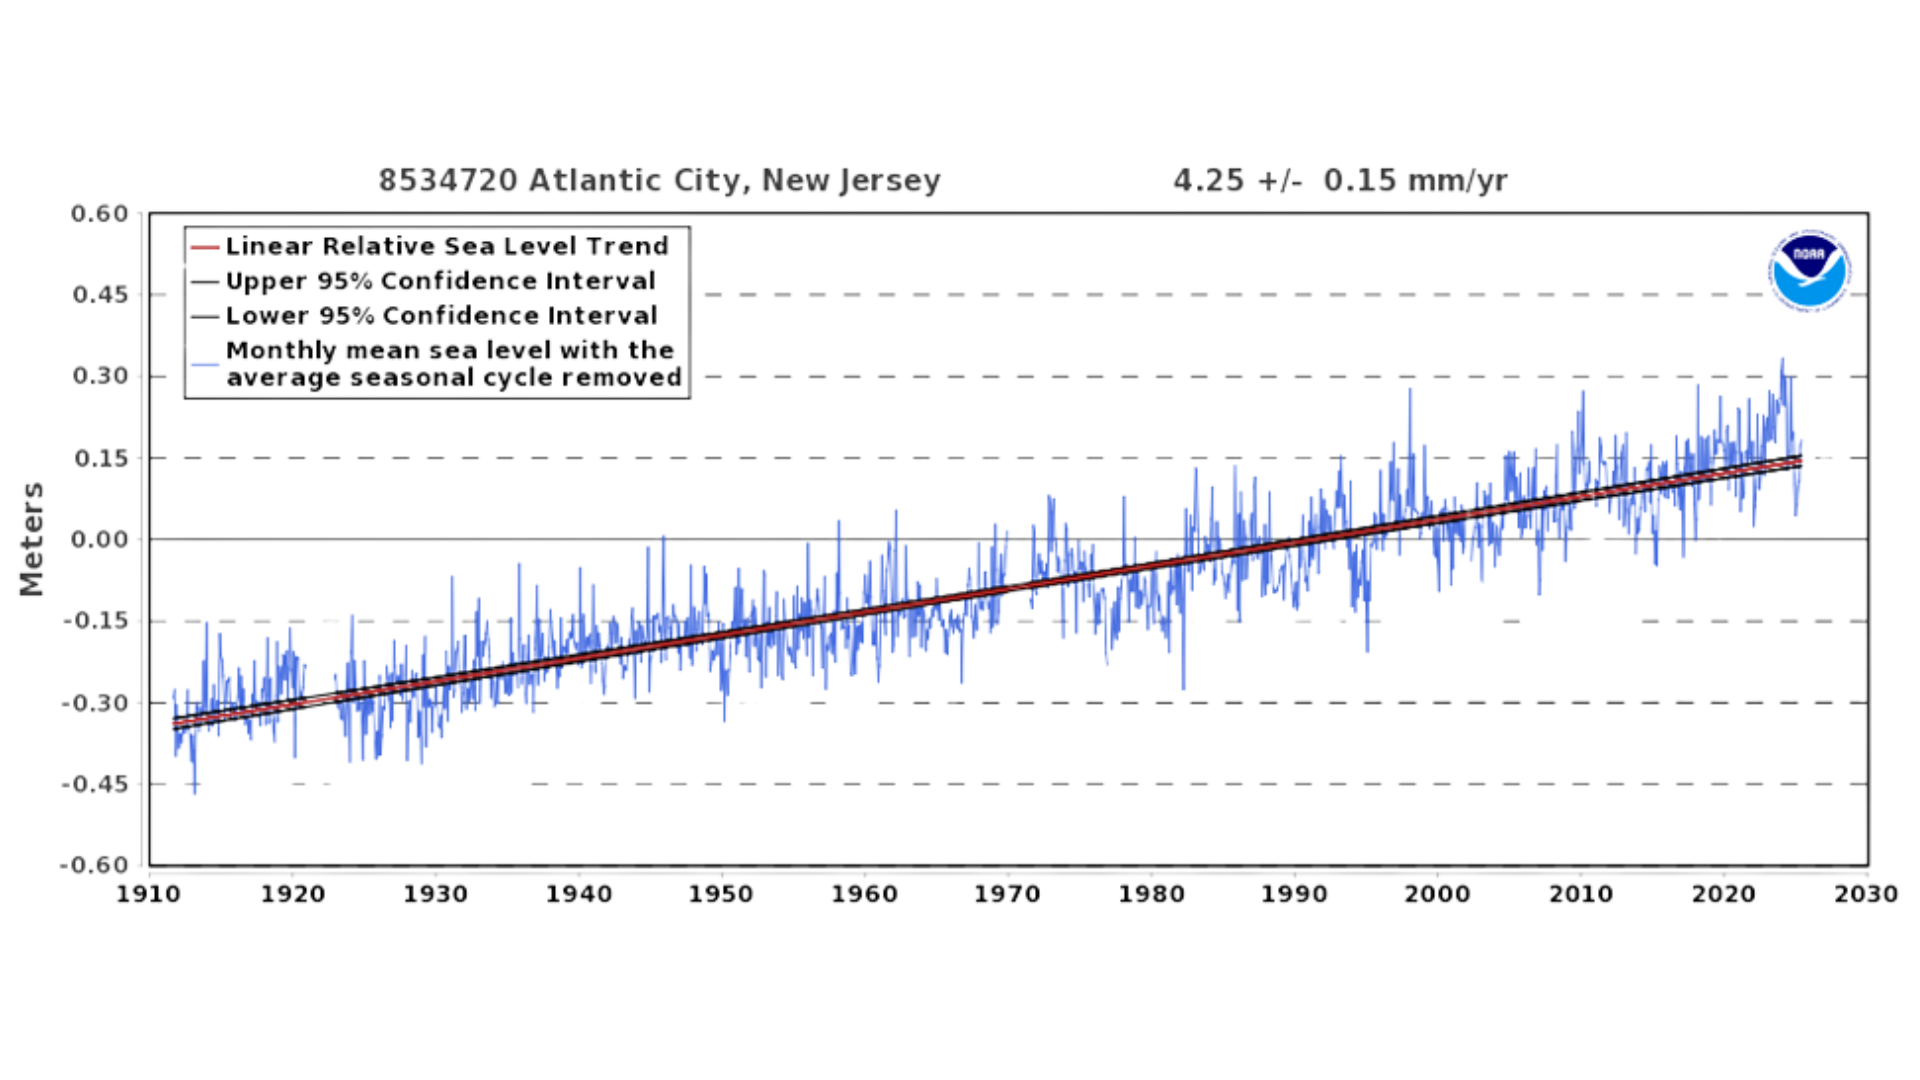
Data from NOAA indicate sea levels at the Atlantic City gauge have increased on average 4.25 mm per year (Figure 17). This rise has already impacted marshes across the watershed, changing how often and how long they are inundated. The developed landscape has also felt these changes. New rules proposed in New Jersey would require resilient design and construction in zones that are projected to be flooded in the future.
THE PROBLEM WITH NITROGEN
Establishing a Total Maximum Daily Load Pollution Budget for Barnegat Bay to Achieve a Nitrogen Water Quality Standard: We’re Almost There!
Nitrogen is an essential nutrient for the estuary, but excessive amounts can severely impact the plants and animals that call the bay home. It originates from numerous upstream sources, including lawn fertilizers, wastewater, animal waste, and even car wash detergents. Locally, the vast majority of this nutrient load is delivered to our waterways through stormwater runoff. Once in the bay, nitrogen is rapidly consumed by aquatic algae and plant life; however, an overload can trigger massive algal blooms that deplete dissolved oxygen levels, threatening fish, seagrasses, and shellfish. Following decades of chronic nutrient loading, reducing these inputs has become a top priority. Establishing an effective reduction framework begins with defining an empirical baseline—a task that required over 15 years of rigorous research and modeling. A finalized target level has now been established for the bay, providing a clear roadmap for long-term water quality recovery.
Phase One: IDENTIFYING DATA GAPS AND PROVIDING A SCIENCE FOUNDATION
Beginning in 2010, the New Jersey Department of Environmental Protection (DEP) hosted a series of public meetings to engage stakeholders in collaboratively developing an action plan for the 660-square-mile Barnegat Bay watershed. These meetings culminated in the announcement of the Ten Point Plan. Under Phase One of this initiative, the DEP launched parallel long- and short-term strategies to assess and protect local water resources. The long-term agenda included adopting a more rigorous water quality standard, decommissioning the Oyster Creek Nuclear Generating Station, funding comprehensive research, and constructing an estuarine water quality model. Meanwhile, short-term actions provided municipal compliance assistance, reduced fertilizer nutrient pollution through targeted education and enforcement, and secured state-acquired land within the watershed. Much of Phase One focused on systematically analyzing the condition of the estuary and its drainage basin by gathering extensive water chemistry, biological, and sediment data. This dataset ultimately fueled the development of hydrodynamic and water quality models used to establish the total nitrogen (TN) target concentrations required to protect sensitive aquatic species. From 2011 to 2014, the DEP funded ten multi-year research projects to evaluate the bay’s ecology, aiming to bridge key knowledge gaps, improve water quality, and advance habitat restoration. These combined findings yielded one of the most comprehensive scientific compilations for a single estuary in the nation: the Fall 2017 Journal of Coastal Research Special Issue #78, A Comprehensive Assessment of Barnegat Bay-Little Egg Harbor, New Jersey.
ESTABLISHING A WATER QUALITY STANDARD
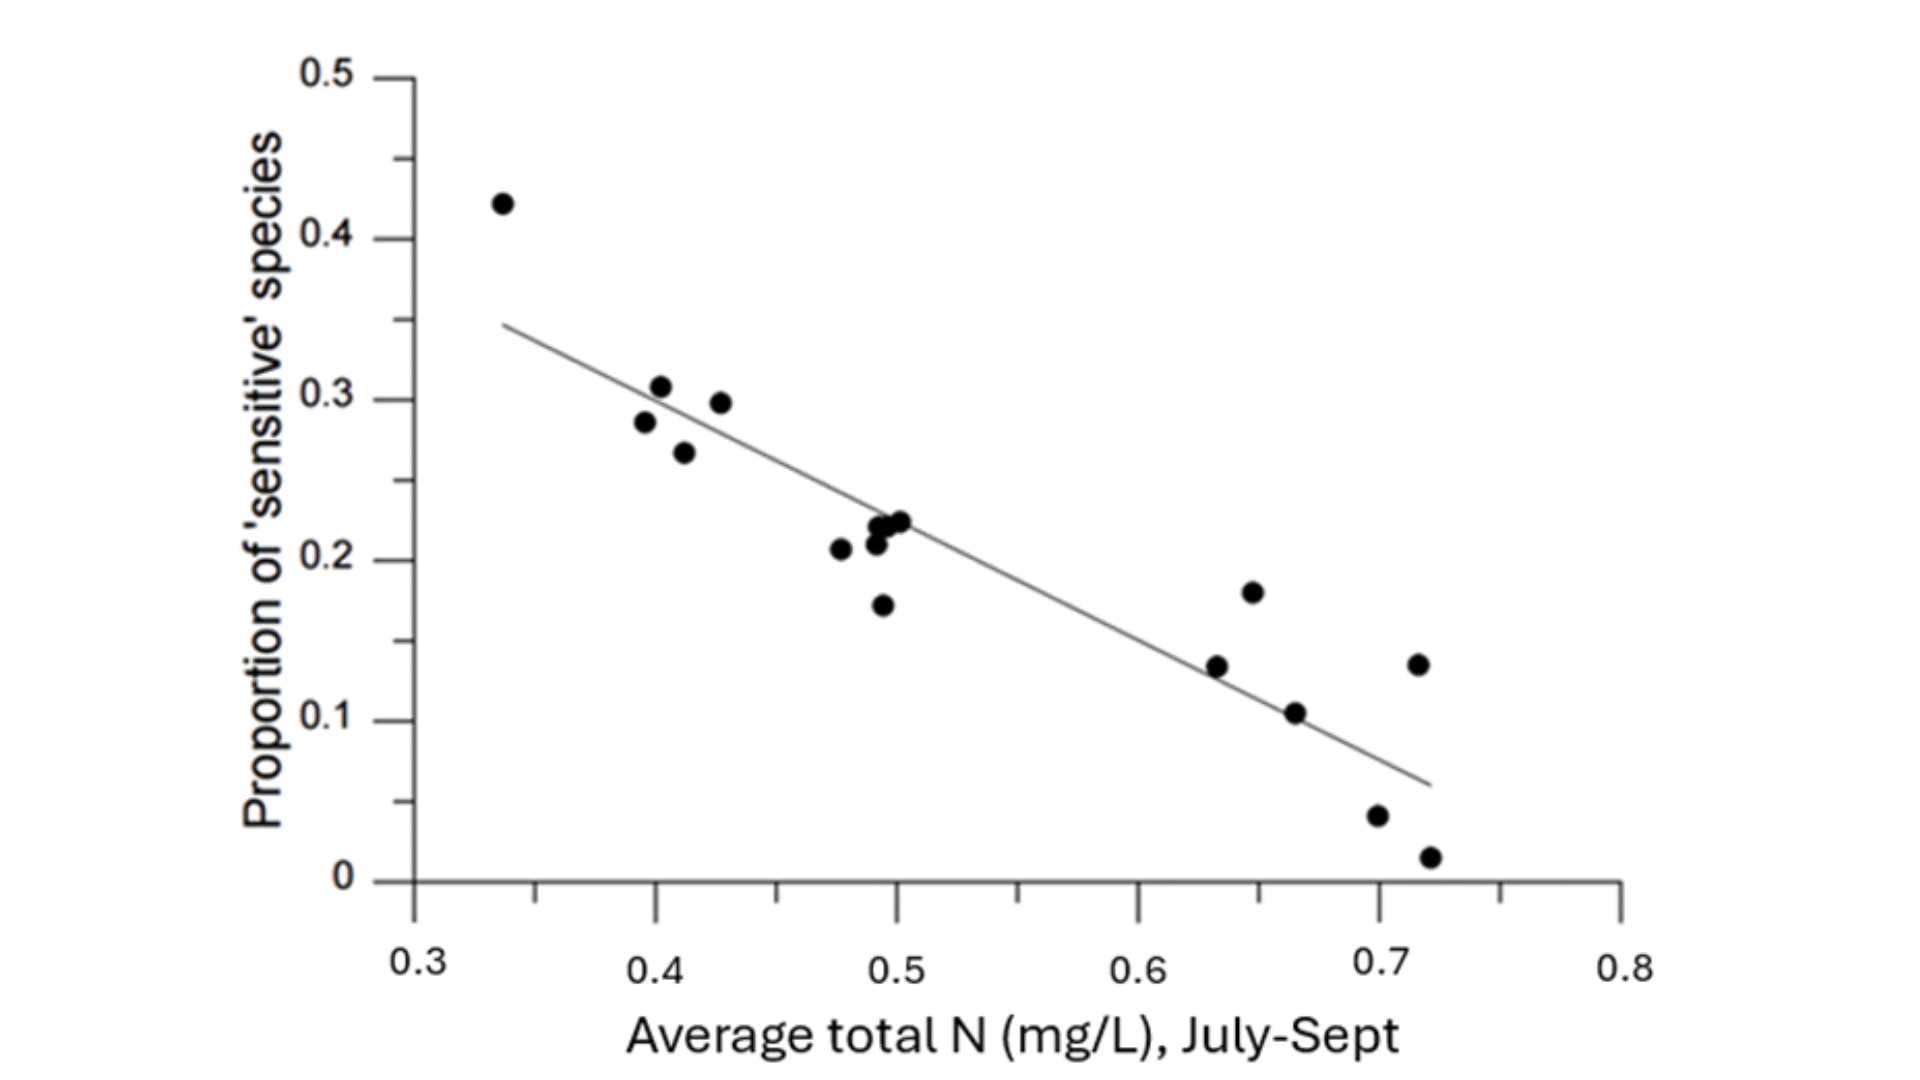
While all of the published research significantly improved our understanding of the estuary, two Phase One studies provided the critical data needed to develop a rigorous water quality standard. First, a benthic macroinvertebrate study by Taghon et al. (2017) identified a strong correlation between total nitrogen (TN) concentrations in the water column and the abundance of pollution-sensitive species (Figure 18). As indicator organisms, the presence or absence of these benthic macroinvertebrates directly reveals the health of their aquatic environment.
To be protective of a healthy macroinvertebrate community as identified in Taghon et al. (2017), the DEP chose 0.45 mg/l (summer average, July 1-September 30) as the site-specific criterion for Barnegat Bay. This value also aligns with thresholds set in other estuaries. The TN criterion derived for Barnegat Bay is intended to support healthy benthic macroinvertebrate communities, which form the base of the aquatic food web and thus are integral to overall aquatic ecosystem health. The establishment of a site-specific TN criterion and the total maximum daily load (TMDL) process will fulfill the Phase One directive to develop a rigorous water quality standard. The establishment of site-specific criteria for a waterbody is supported by the State’s nutrient policies, a component of the N.J. Surface Water Quality Standards (N.J.A.C. 7:9B-1.15(g)2). The policy allows for the development of watershed-specific numeric translators as part of developing a TMDL.
Equally if not more important, the U.S. Geological Survey (USGS) also “coupled” complex hydrodynamic (ROMS) and water quality (WASP) models, which accurately simulated the nutrient concentrations throughout the bay responding to nitrogen loads and reductions from major sources throughout the watershed (DePaul, 2025). The ROMS-WASP model developed by USGS for Barnegat Bay simulated water quality conditions from March 7, 2012 to September 30, 2012. A Model Evaluation Group was engaged in 2019-2020 to provide an independent and objective review for determining the adequacy of calibration, strengths and weaknesses of the calibrated model, and subsequent usability of the model for TMDL and site-specific criteria development and other DEP management decisions. They concurred that the model served as a reasonable representation of spatial and temporal distributions of salinity, nutrients, and chlorophyll a. Based on the calibrated model, the northern part of the bay exhibited summer average (July 1-September 30) concentrations exceeding 0.45 mg/L, while the southern part of Barnegat Bay had concentrations less than 0.45 mg/L. The northern part of the bay would be considered as impaired for TN using 0.45 mg/L as the threshold because it does not meet the site-specific TN criterion.
The published model provided the foundation for establishment of the TMDL of nitrogen for the bay and for future actions to protect and restore the Bay’s living resources. The Strategy laid out short-term through long-term timeframes for implementable actions that would improve the overall ecological health of the Bay.
PHASE TWO: RESTORING, ENHANCING, AND PROTECTING THE BAY
Building upon the accomplishments of Phase One, the Barnegat Bay Restoration, Enhancement and Protection Strategy (REPS, Strategy, or Phase Two) was shared with the public in October 2017. The Strategy highlighted the Phase One results to establish a total nitrogen (TN) and TMDL for the Bay and laid out timeframes for actions to improve the overall ecological health of the Bay. The Barnegat Bay TN TMDL, essentially a “pollution budget”, establishes the nonpoint source (NPS) load reductions needed achieve the target nitrogen water quality standard for the Bay.
In 2018, the DEP provided up to $10 million through a combination of low interest loans and grants to begin the implementation of the Strategy: see https://dep.nj.gov/wlm/grants/funded-projects/ for projects funded and completed. The funded projects serve as a foundation for efforts to reduce nutrient loadings to the bay.
The DEP held three stakeholder meetings (November 2023, January 2024, and October 2024) to publicly share and discuss the Phase One findings, the specific load reductions that would be required from both the northern and southern parts of the watershed to lower nutrient concentrations in the north and prevent exceedances of loadings in the south, and the preliminary Phase Two efforts. The recordings of these sessions may be viewed at https://www.nj.gov/dep/barnegatbay/.
The culmination of this work over more than 15 years and other measures will be encompassed in the TMDL Implementation Section of the forthcoming TMDL report to be released by the DEP later this year. The Barnegat Bay Nitrogen TMDL will establish site-specific TN criterion for the bay and require loading reductions from nonpoint sources serving as a vital tool for stakeholders to implement to improve ecological health of the bay.
The DEP and the BBP thank the many partners, stakeholders, and members of the public who have contributed to the development of this comprehensive effort to better understand, protect, and restore the Barnegat Bay-Little Egg Harbor estuary and its watershed.
Total Nitrogen Status and Trends
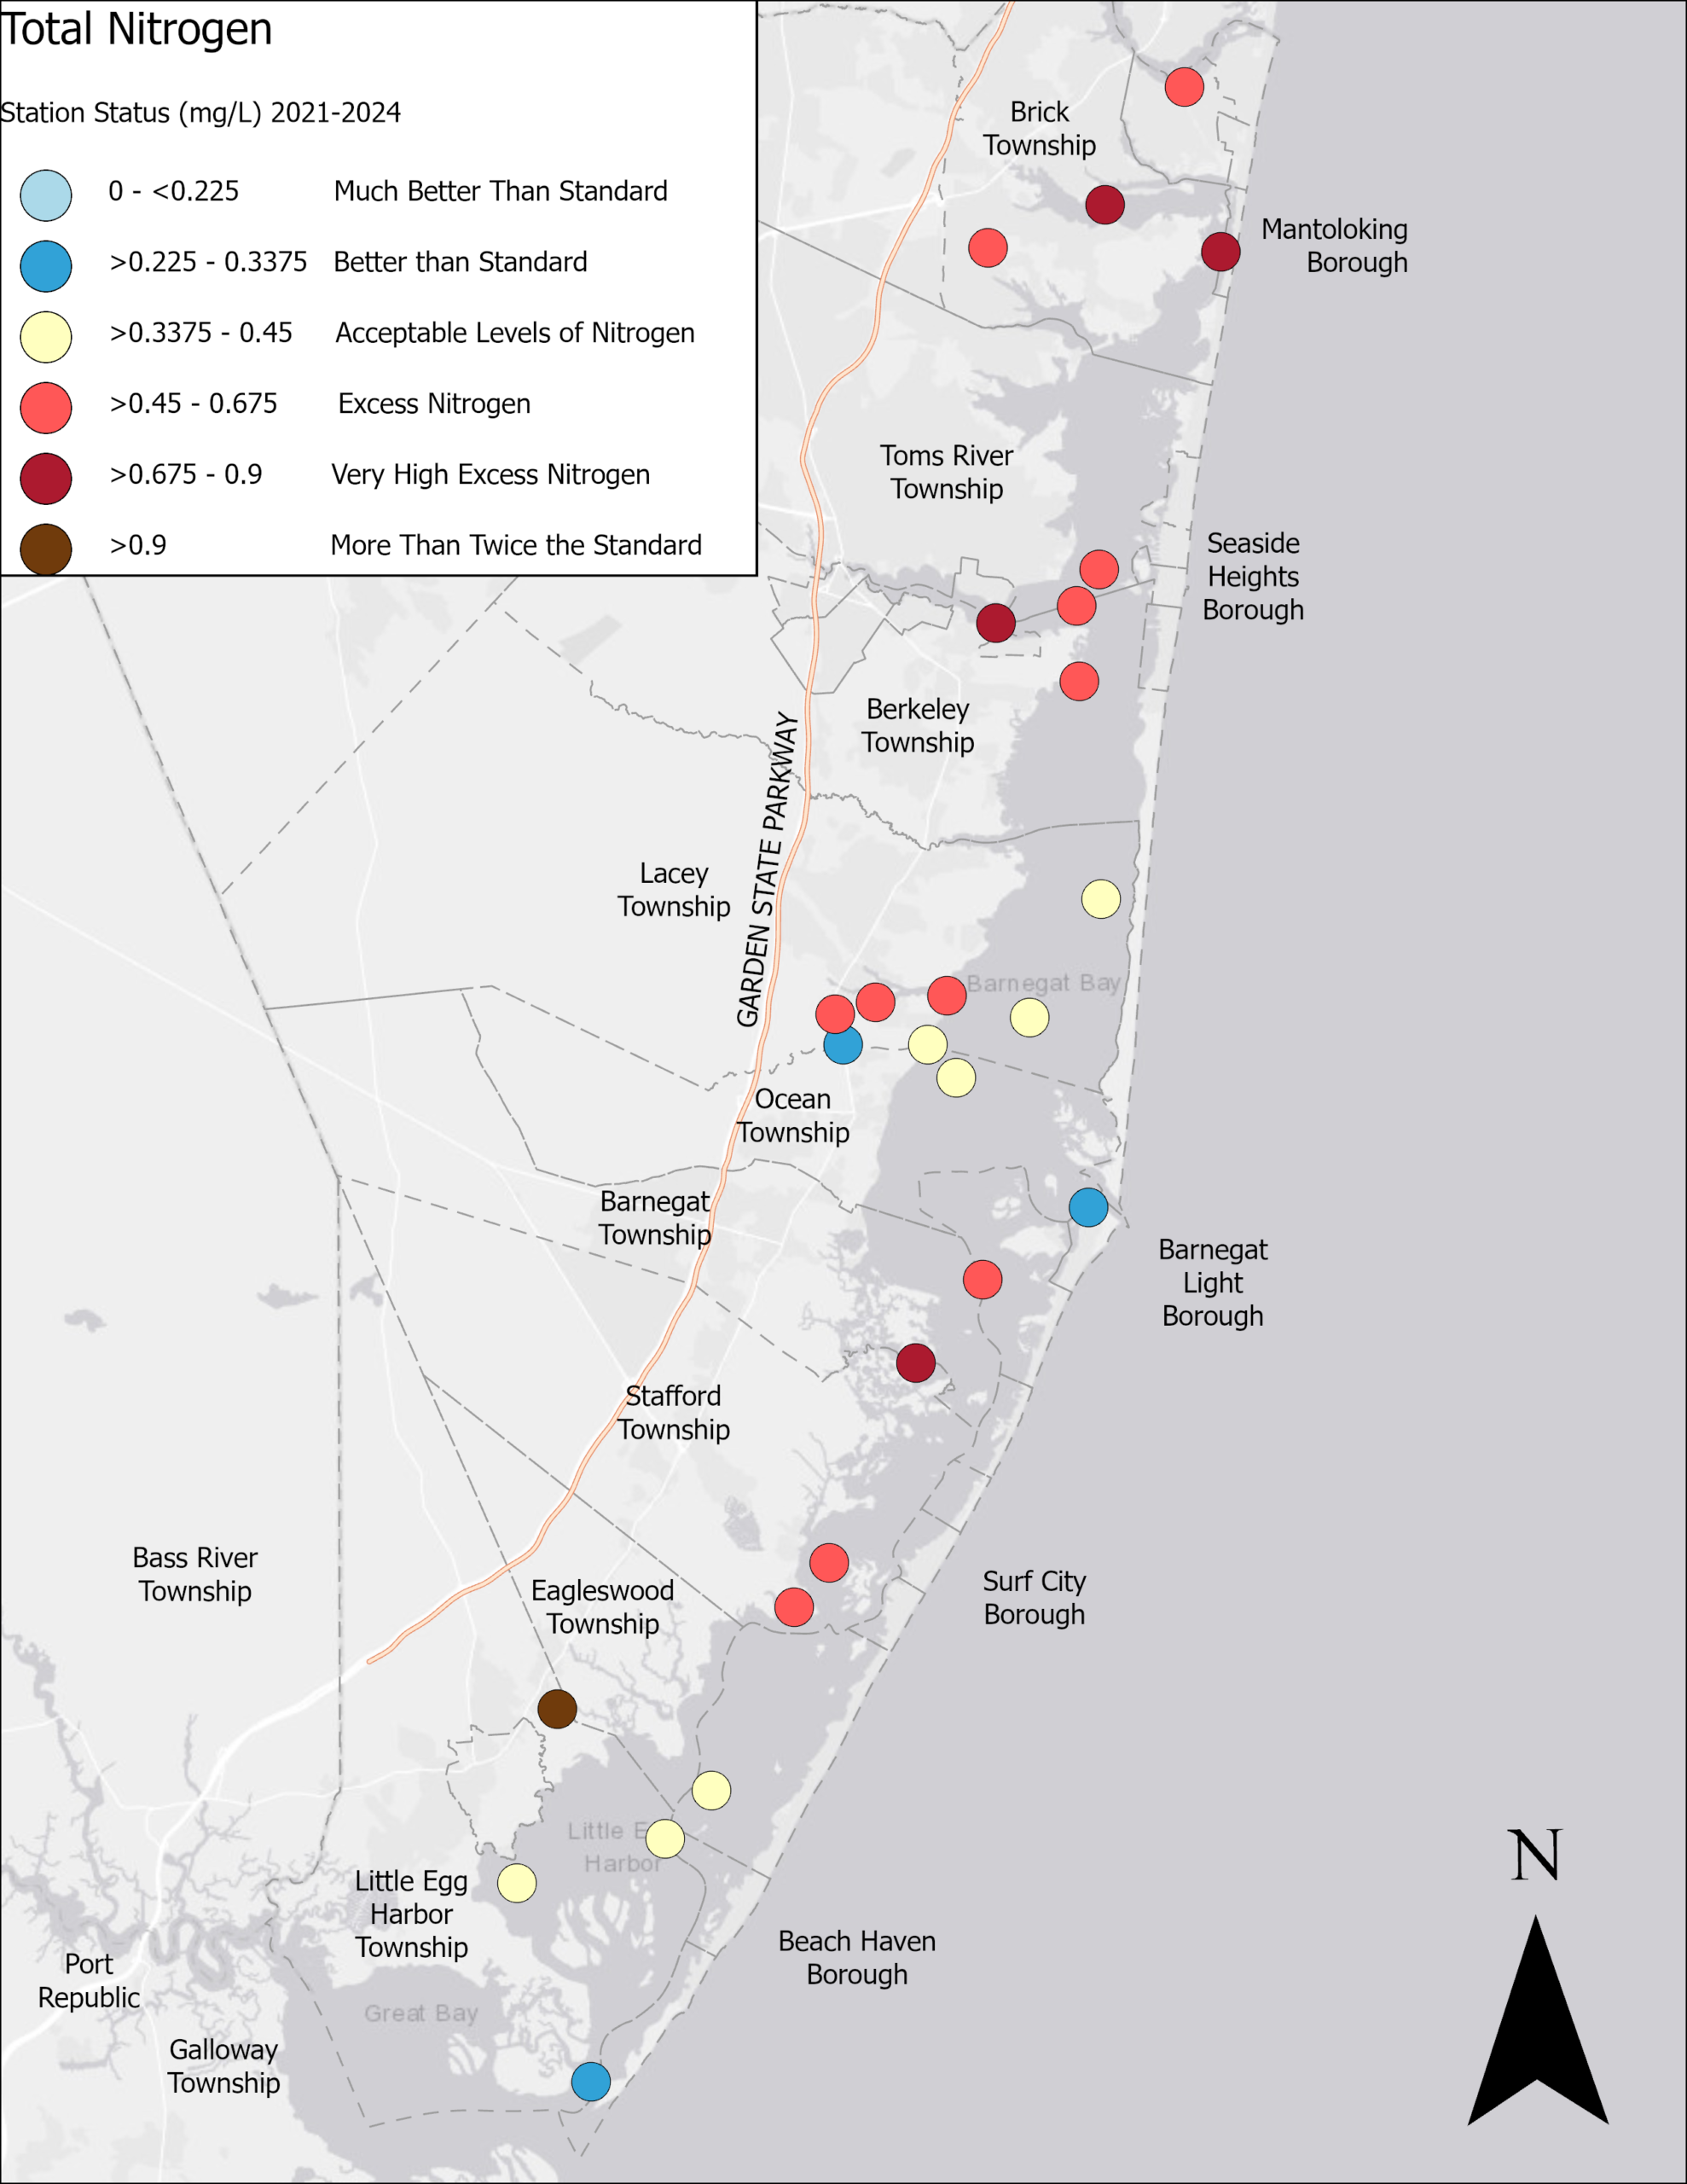
How Does Current Water Quality Compare to the Proposed TMDL?
Figure 19 depicts average Total Nitrogen concentrations from 2021 through 2024 using data collected during the critical summer months from July through September. This station status serves to gauge typical summer nutrient levels across the estuary. For historical context, stations with sufficiently long data records were also analyzed to detect long term shifts in Total Nitrogen.
The findings reveal that areas near the ocean inlets generally meet the proposed Total Maximum Daily Load because frequent tidal exchange with the Atlantic Ocean dilutes localized nutrient buildup. Conversely, regions further from the inlets, which experience minimal ocean flushing and heavy stormwater runoff from surrounding tributaries, exhibit much higher nitrogen concentrations. Multiple sections of the estuary, particularly within the northern bay, fail to meet the proposed nitrogen standard, strongly underscoring the urgent necessity of a formalized management plan.
Crucially, trend analyses show that no monitoring stations are experiencing significant degradation over time. This stabilizing trend is a remarkable milestone and a direct testament to the coordinated mitigation efforts enacted by local municipalities, state and county agencies, environmental organizations, and dedicated residents. However, substantial work remains, especially in the vulnerable northern basin. While conditions have successfully stabilized, no stations are yet showing definitive improvements in water quality. Nevertheless, the formal adoption of the new regulatory limits will provide the framework and resource support needed to drive future initiatives to reduce nitrogen.
ACKNOWLEDGEMENTS
This report is possible thanks to the significant contributions of the Barnegat Bay Partnership’s Scientific and Technical Advisory Committee members, the Advisory Committee members, and the numerous partner organizations which contributed information on relevant monitoring and modeling projects within the watershed.
**Although the information in this document has been funded wholly or in part by the United States Environmental Protection Agency pursuant to a grant agreement with Ocean County College, it has not gone through the Agency’s publication review process and may not necessarily reflect the views of the Agency; therefore, no official endorsement should be inferred.**
advisory committee
Name
Andrew McGowan, Co-Chair
Karen Greene, Co-Chair
Keith B. Marcoon
Robert Shertenleib
Peter Blum
Monica Chasten
Tim Oden
Jonathan Kennen
Dr. Bob Schuster
David Steinmann
Angela Andersen
Dr. Peter Rowe
Michael J. Danko
Anthony M. Agliata
Evangelista Vasilakis
Michael DeLuca
Andrea Habeck
Elizabeth Butler
Barbara Spinweber
Cassandra Ponds
Dr. Steve Yergeau
George Browne
Thomas Fote
Melissa Danko
Kayci Clayton
Mary Lancaster
Christine Raabe
Becky Laboy
Mary Bavais
Michael Gross
Dr. Jessica Lisa
John Protonentis
Peter Straub
Sandra Lazzaro
Joel Mott
Amber Malm
Tony McDonald, Esq.
Dr. Thomas Herrington
Meredith Comi
Jaclyn Rhoads
Carlton Montgomer, Esq.
Dr. Heidi Yeh
Charles Caruso, Esq.
John Meiman
Rick Bushnell
Bill Walsh
Eric Schrading
Dr. Kim McKenna
Dr. Shuting Lu
Rob Karl
Cindy Zipf
Dr. Swarna Muthukrishnan
Organization
NOAA Fisheries Habitat Conservation Division
Ocean County Utilities Authority
Ocean County Utilities Authority
NJ Department of Environmental Protection
U.S. Department of Agriculture, Natural Resources Conservation Service
Long Beach Township Marine Education Field Station
Ocean County Planning Department
Ocean County Planning Department
Jacques Cousteau National Estuarine Research Reserve
Jacques Cousteau National Estuarine Research Reserve
U.S. Environmental Protection Agency, Region 2
U.S. Environmental Protection Agency, Region 3
U.S. Environmental Protection Agency, Region 4
Rutgers Cooperative Extension of Ocean County
Jersey Coast Anglers Association
Jersey Coast Anglers Association
Marine Trades Association of NJ
Ocean County Soil Conservation District
Ocean County Soil Conservation District
Ocean County Health Department
Monmouth University, Urban Coast Institute
Monmouth University, Urban Coast Institute
Monmouth University, Urban Coast Institute
U.S. Fish and Wildlife Service, NJ Field Office
Stockton University, Coastal Research Center
Brick Township Municipal Utilities Authority
SICENCE AND TECHNICAL ADVISORY COMMITTEE
Name
Gregg Sakowicz, Chair
Dr. Thomas Grothues
Dr. Christine Thompson
Colleen Adams
Dr. Steven Yergeau
Dr. Douglas Zemeckis
Jessie Murray
Christine Wieben
Dr. Jonathan Kennen
John Protonentis
David Steinmann
Dr. Bob Schuster
Kim Cenno
Michael Auriemma
Dr. James Vasslides
Rob Karl
Gerald Wilders
Barbara Spinweber
Dr. Peter Rowe
Michael J. Danko
Dr. Joe Smith
Andrew McGowan
Evangelia Vasilakis
Jennifer Morganti
Robert Shertenlieb
Keith Marcoon
Dr. Jessica Lisa
Dr. Heidi Yeh
Charles Caruso, Esq.
John Meiman
Ed Pietrowicz
Bill Walsh
Rick Bushnell
Dr. Swarna Muthukrishnan
Christine Raabe
Kristin Adams
Dr. Shuting Liu
Dr. Jun Cheng
Dr. John Wnek
Dr. Thomas Herrington
Meredith Comi
William Shadel
Organization
Jacques Cousteau National Estuarine Research Reserve
Jacques Cousteau National Estuarine Research Reserve
Rutgers University Cooperative Extension, Ocean County
Rutgers University Cooperative Extension, Ocean County
Ocean County Public Health Department
U.S. Department of Agriculture, Natural Resources Conservation Service
NJ Department of Environmental Protection
NJ Department of Environmental Protection
NJ Department of Environmental Protection, Marine Habitat and Shellfish
Brick Township Municipal Utilities Authority
Brick Township Municipal Utilities Authority
U.S. Environmental Protection Agency, Region 2
U.S. Fish and Wildlife Service, Edwin B. Forsythe National Wildlife Refuge
Ocean County Planning Department
Ocean County Planning Department
Ocean County Utilities Authority
Ocean County Utilities Authority
Ocean County Soil Conservation District
Ocean County Soil Conservation District
Ocean County Vocational and Technical School MATES
Monmouth University Urban Coast Institute
Monmouth University Urban Coast Institute
GLOSSARY OF IMPORTANT TERMS